Open Access
Fig. 4.
Download original image
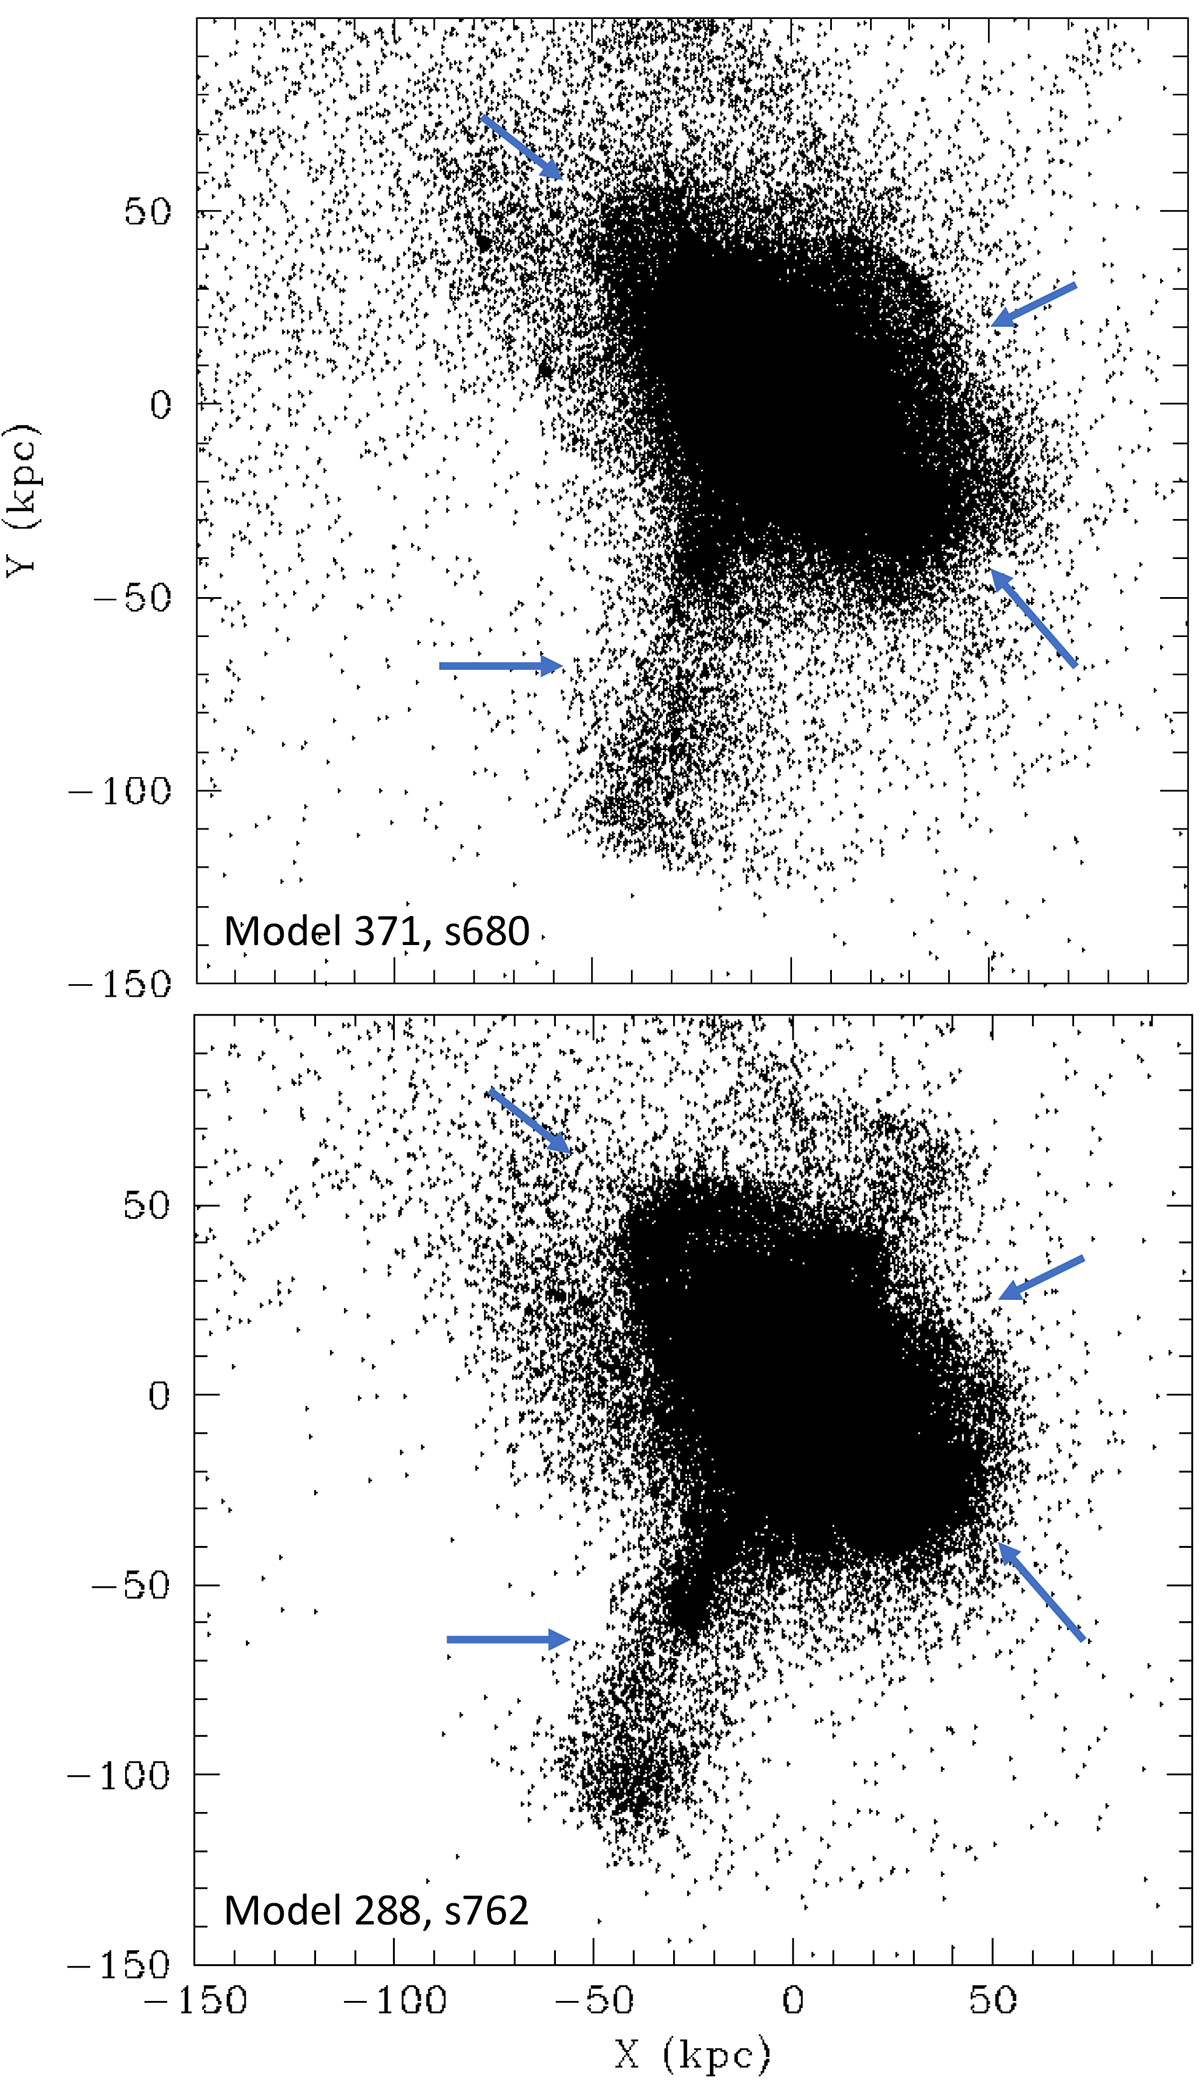
Sky projection of the stellar density of model 371 (top panel) that can be compared to model 288 (bottom panel) as well as other similar modeling made by H18 (see their Figure 8). The arrows indicate major features, from left to right and top to bottom: NE clump, W shell, G1 clump, and the giant stream.
Current usage metrics show cumulative count of Article Views (full-text article views including HTML views, PDF and ePub downloads, according to the available data) and Abstracts Views on Vision4Press platform.
Data correspond to usage on the plateform after 2015. The current usage metrics is available 48-96 hours after online publication and is updated daily on week days.
Initial download of the metrics may take a while.