Fig. 3.
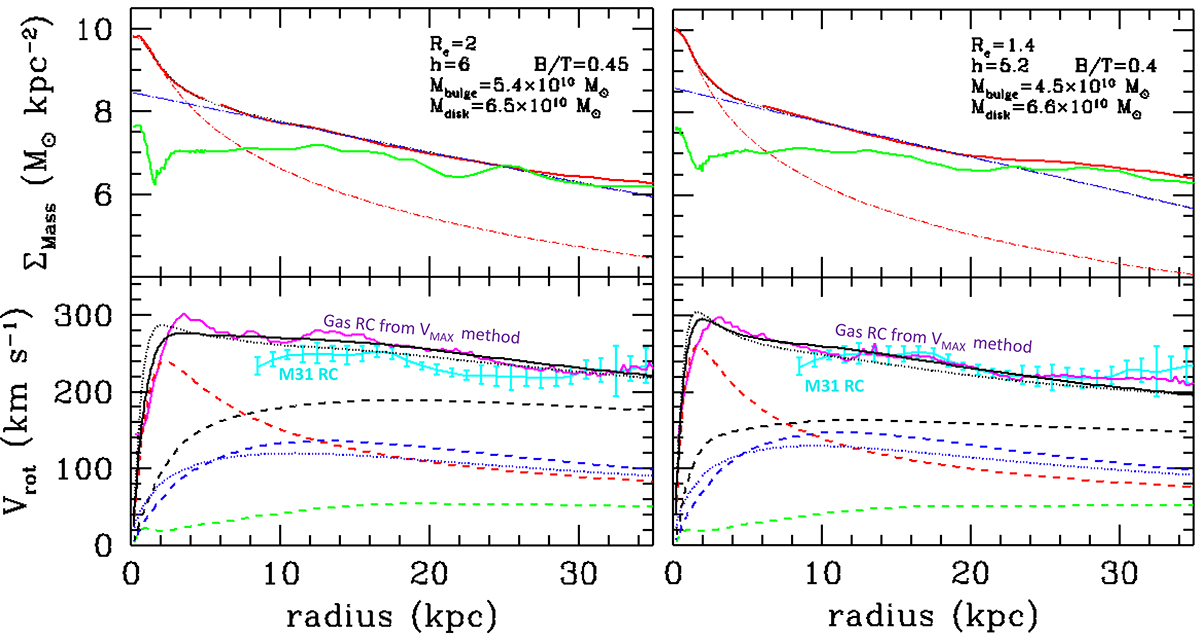
Download original image
Derivation of the M31 modeled RC after decomposition of the baryonic component into a disk and bulge component for models 288 (left) and 371 (right). Top panels: Stellar mass surface density in logarithmic scale (red solid line) that is decomposed into a bulge component (red dashed line) and a disk (blue long-dashed line) together with that of the HI gas (green dashed line). The bulge and disk mass distributions result from a Plummer and exponential disk profile, respectively, and the characteristic numbers are given in the top right of each panel. Bottom panels: Same as the top panels of Figure 2 except that the black line represent the RC obtained after accounting for the bulge (red dashed line), axisymmetric disk (blue dashed line), and DM (black dashed line) components, respectively. The RC described by the maximal velocity method from Figure 2 is displayed with a magenta line, while the M31 RC is shown by a cyan line. The blue and black dotted lines illustrate the resulting RCs when the disk is (mis)-represented by a spherical component.
Current usage metrics show cumulative count of Article Views (full-text article views including HTML views, PDF and ePub downloads, according to the available data) and Abstracts Views on Vision4Press platform.
Data correspond to usage on the plateform after 2015. The current usage metrics is available 48-96 hours after online publication and is updated daily on week days.
Initial download of the metrics may take a while.