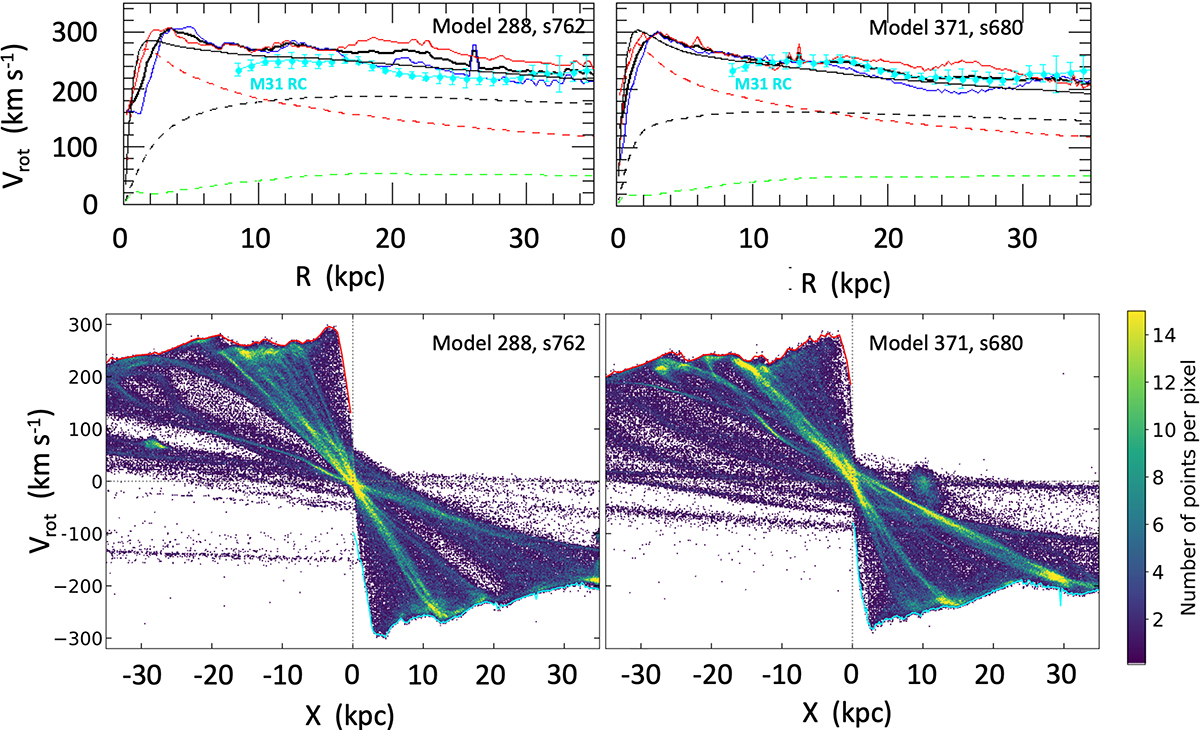
Fig. 2.
Download original image
Derivation of the terminal velocity for two M31 models based on the maximal velocity method of the position-velocity diagram (Chemin et al. 2009) and comparison with the observed M31 RC (see Sect. 2). Top panels: RC derived from the maximal velocity method for models 288 (left) and 371 (right). The blue, red, and black lines represent RCs of the approaching and receding sides and the average. The observed M31 RC is shown by cyan dots with error bars and a cyan line. For illustration, the contribution of stars, DM, and gas to the modeled RCs are given by red, black, and green dashed lines, assuming a spherical symmetry, and the smooth black line corresponds to their summation. Bottom panels: Position-velocity diagram plotted as a kernel density plot for gas particles with T ≤ 20 000 K (green dots) along the receding (X < 0) and approaching (X > 0) sides, with red and blue lines representing the maximal velocities that are also shown in the top panels. The figures also account for the gas particle densities in the phase diagram, which could be reasonably well compared to Figure 5 of Chemin et al. (2009). In all panels, there are a few spikes that are due to single particles, which have been removed for further analyses (see Figure 3).
Current usage metrics show cumulative count of Article Views (full-text article views including HTML views, PDF and ePub downloads, according to the available data) and Abstracts Views on Vision4Press platform.
Data correspond to usage on the plateform after 2015. The current usage metrics is available 48-96 hours after online publication and is updated daily on week days.
Initial download of the metrics may take a while.