Fig. 10.

Download original image
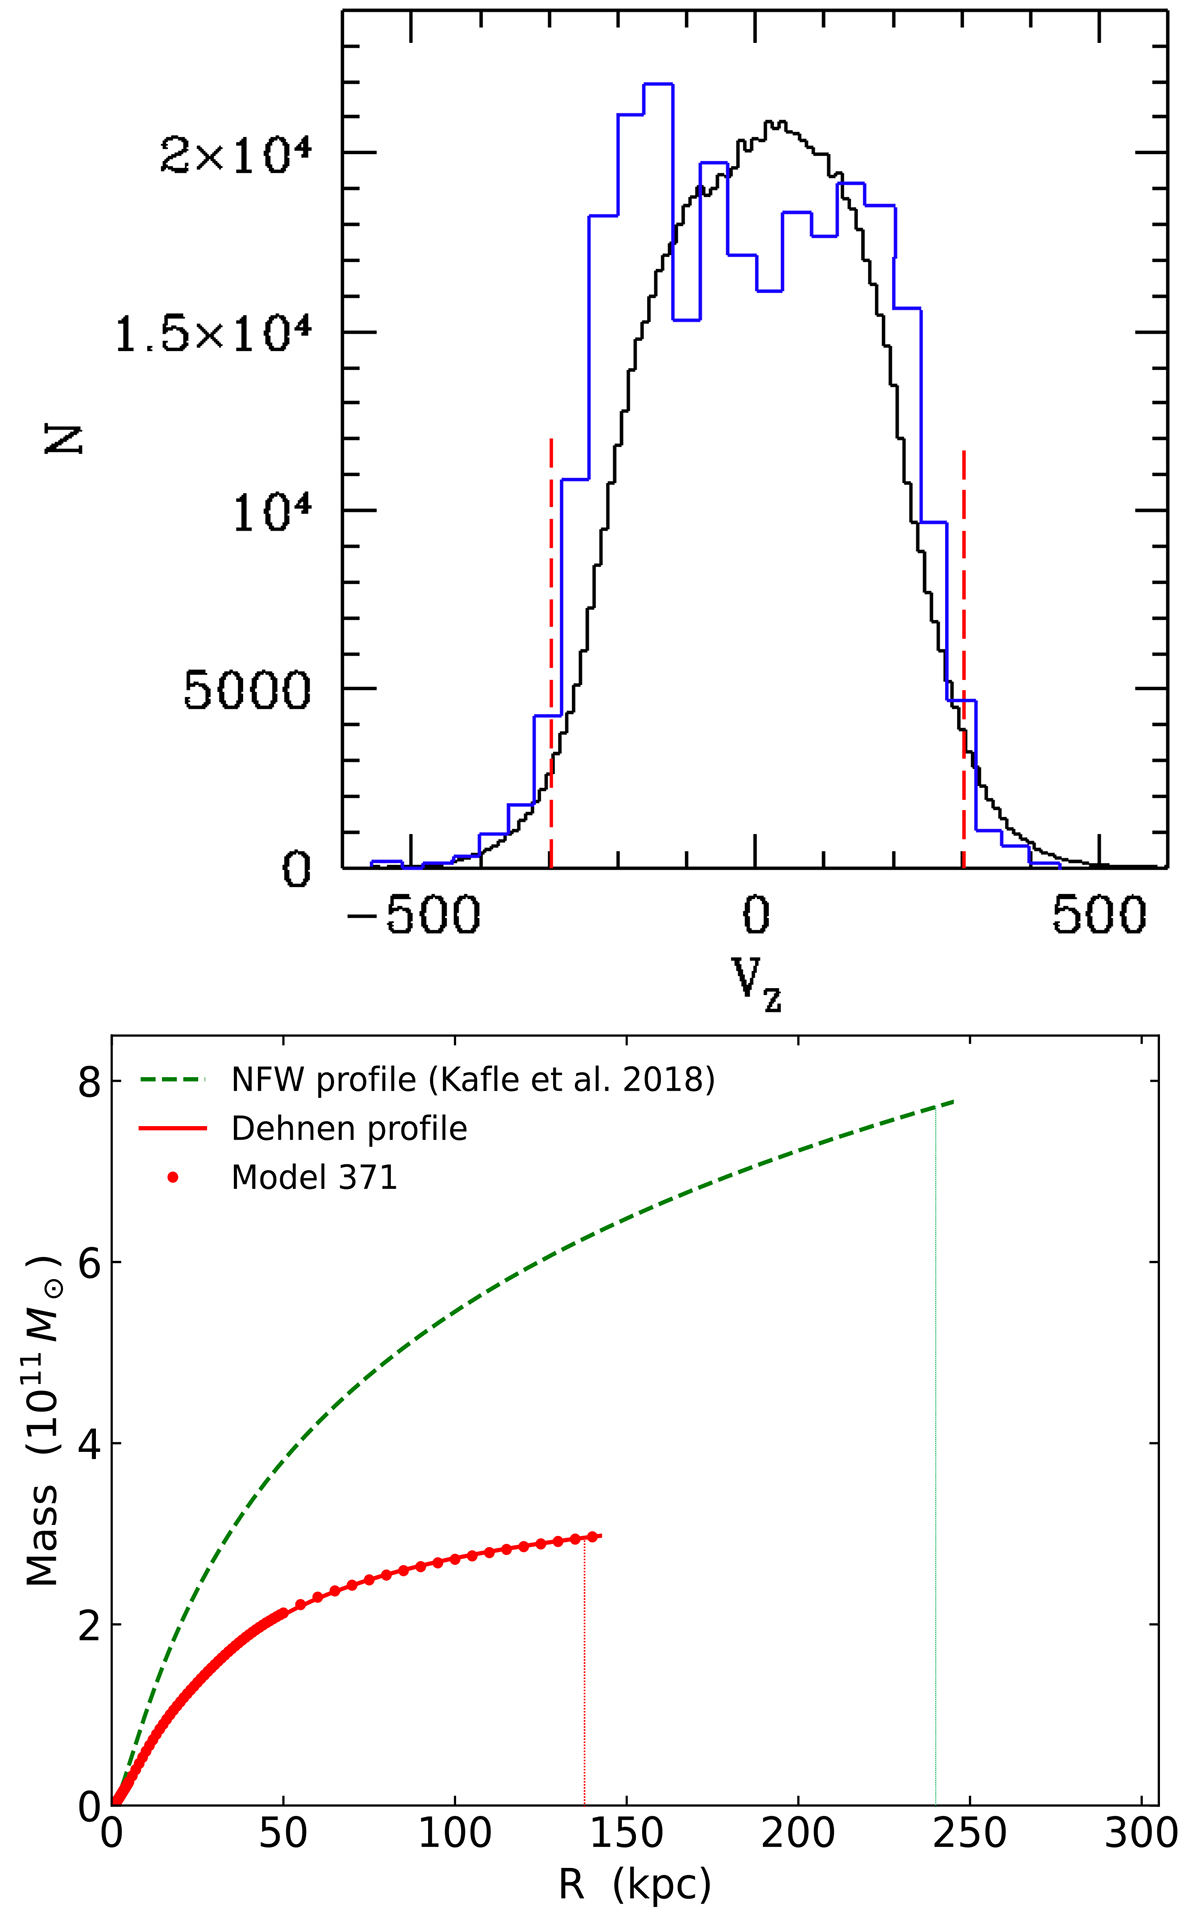
Comparison with Kafle et al. (2018). Top panel: Distributions of PNe radial velocities (blue histogram) from Kafle et al. (2018) compared to predictions from model 371 (black histogram). The two red-dashed vertical lines show the limits chosen by Kafle et al. (2018) to calculate M31’s escape velocity from PNe with absolute velocity values in excess of 300 km s−1. Bottom panel: Cumulative mass M200 for Model 371 (red points) fit by the function of Dehnen (1993) (red line, see Eq. (1)) compared to that from Kafle et al. (2018, gree-dashed line). Vertical dotted lines indicate the corresponding R200 radii: 137 and 240 kpc, respectively.
Current usage metrics show cumulative count of Article Views (full-text article views including HTML views, PDF and ePub downloads, according to the available data) and Abstracts Views on Vision4Press platform.
Data correspond to usage on the plateform after 2015. The current usage metrics is available 48-96 hours after online publication and is updated daily on week days.
Initial download of the metrics may take a while.


