Open Access
Fig. 14
Download original image
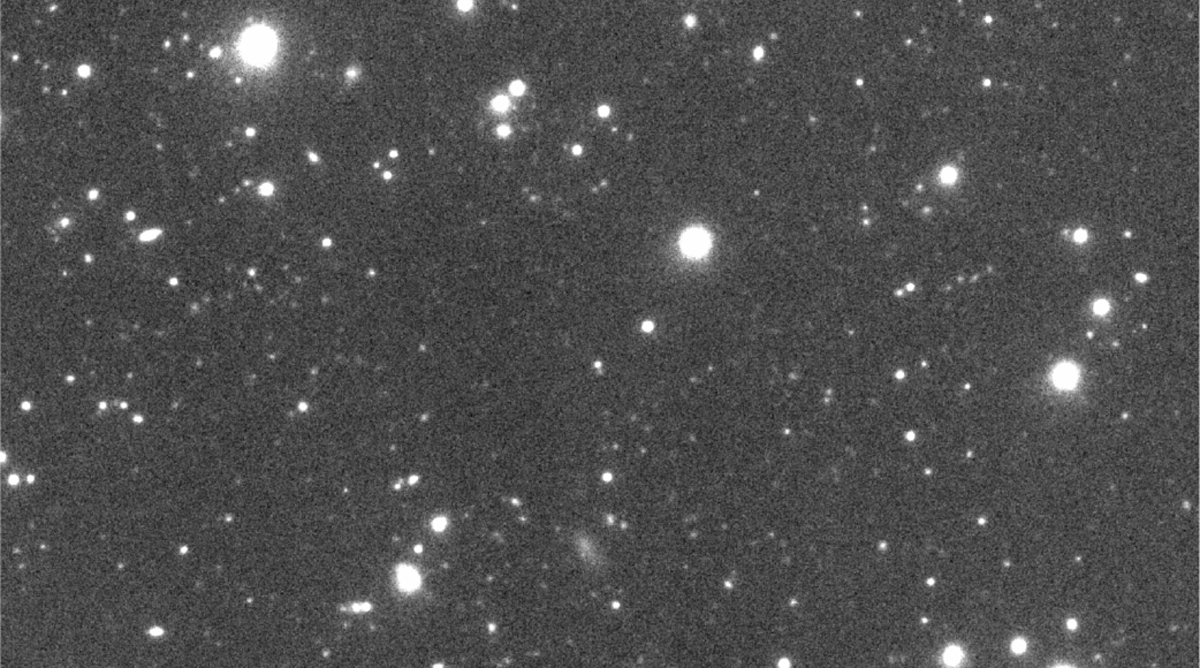
Small portion of an ILMT co-added map. This i′-band image was created from 29 individual observations. The region shown is approximately 10 × 5 arcmin and is centred at 12h34m51s +29°34′50′″. North is up, and east is to the left. One can see numerous faint galaxies.
Current usage metrics show cumulative count of Article Views (full-text article views including HTML views, PDF and ePub downloads, according to the available data) and Abstracts Views on Vision4Press platform.
Data correspond to usage on the plateform after 2015. The current usage metrics is available 48-96 hours after online publication and is updated daily on week days.
Initial download of the metrics may take a while.