Fig. 6
Download original image
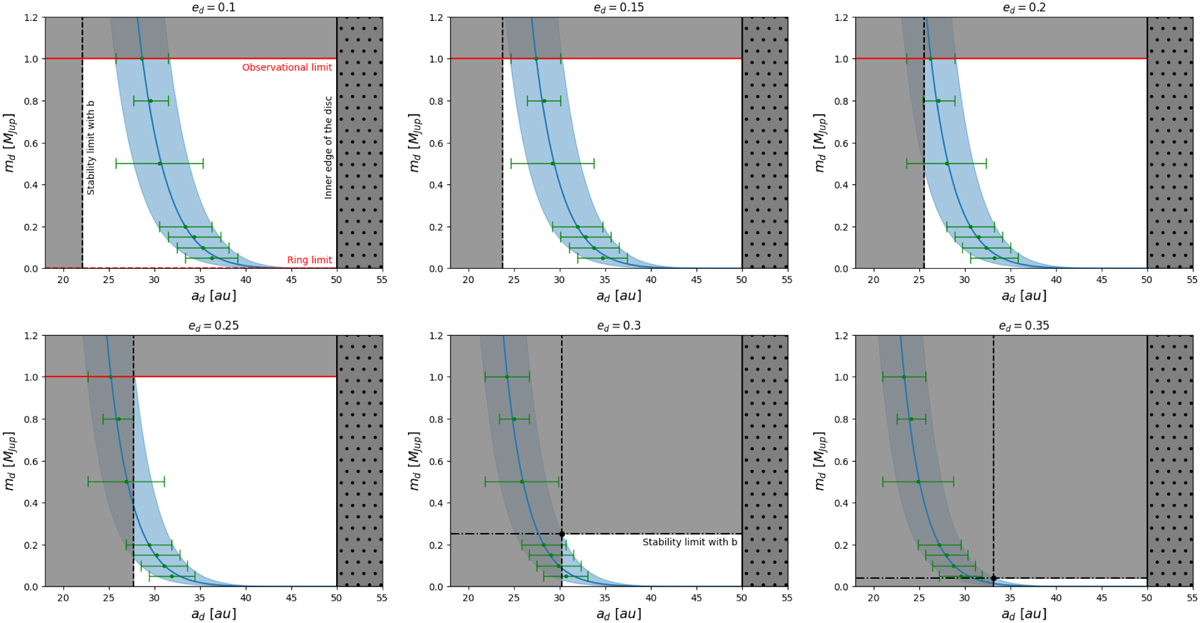
Combinations of β Pic d’s mass and semi-major axis for various eccentricities, within observational constraints that successfully reproduce the disk profile at 50 au. The plotting conventions are identical to Fig. 4. The ring limit quickly tends to zero as the eccentricity increases. The minimum semi-major axis stability limit with β Pic b imposes a maximum mass limit (dot-dashed black line), determined by the intersection (black dot) with the fit’s right extremum of the acceptable range of β Pic d’s semi-major axis. This maximum mass limit decreases as eccentricity increases, becoming more restrictive than the observational mass limit for ed ≳ 0.25, and tends towards zero as eccentricity continues to increase (see Fig. 7).
Current usage metrics show cumulative count of Article Views (full-text article views including HTML views, PDF and ePub downloads, according to the available data) and Abstracts Views on Vision4Press platform.
Data correspond to usage on the plateform after 2015. The current usage metrics is available 48-96 hours after online publication and is updated daily on week days.
Initial download of the metrics may take a while.