Fig. 8.
Download original image
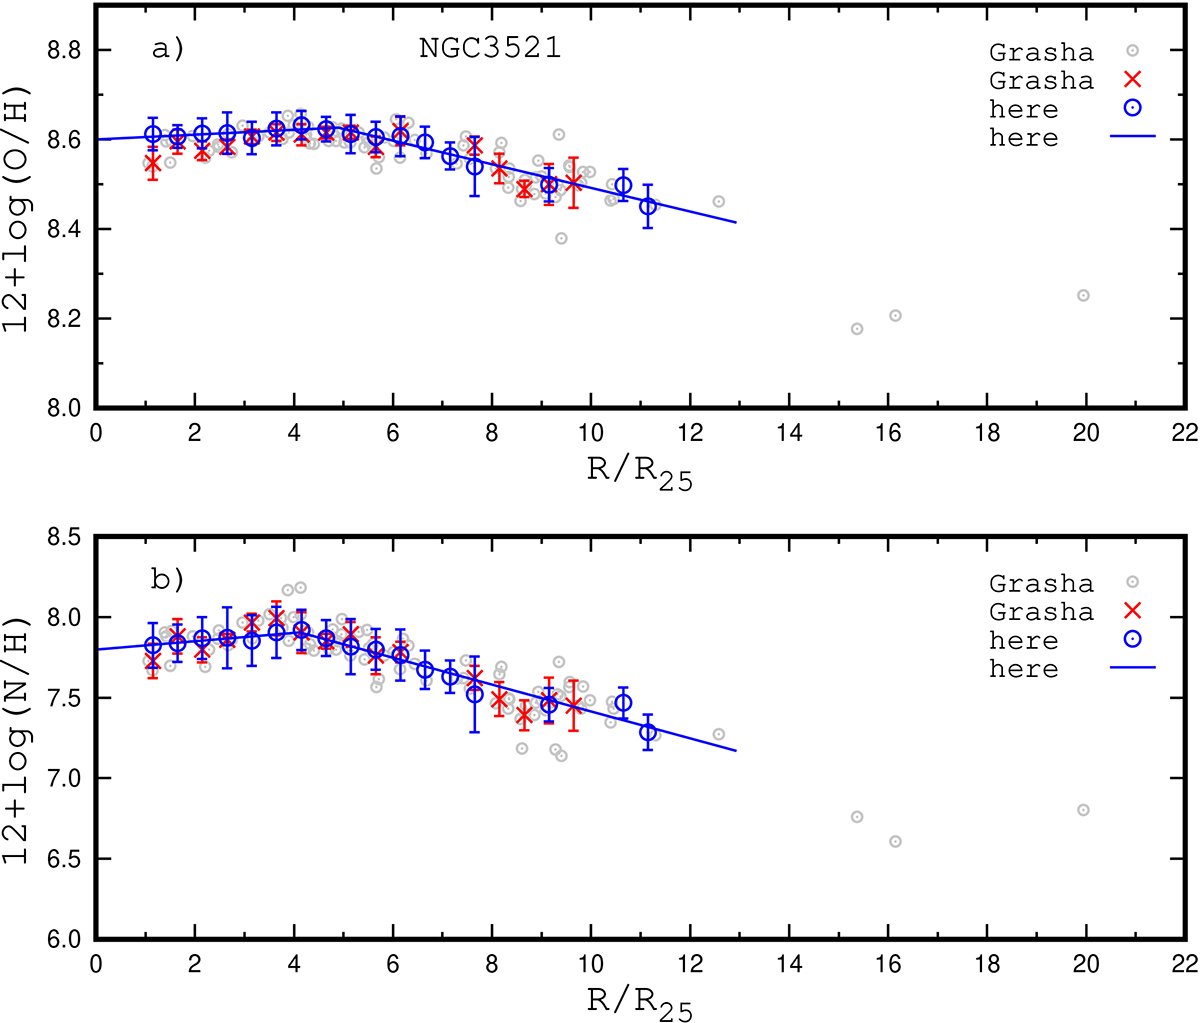
Comparison between abundances in NGC 3521 based on fibre measurements here and abundances based on H II regions from Grasha et al. (2022). Panela: Radial oxygen abundance distribution. The grey circles denote the R calibration-based abundances for the individual H II regions from Grasha et al. (2022), the red crosses denote the median values of the oxygen abundances in bins of 0.5 kpc in radius, and the bars show the scatter in O/H around the median value of each bin. The blue circles denote the median values of the oxygen abundances in bins for our fibre measurements, the line shows the O/H – R relation for those data (the same as in Fig. 4). Panelb: Same as panel (a), but for the nitrogen abundances.
Current usage metrics show cumulative count of Article Views (full-text article views including HTML views, PDF and ePub downloads, according to the available data) and Abstracts Views on Vision4Press platform.
Data correspond to usage on the plateform after 2015. The current usage metrics is available 48-96 hours after online publication and is updated daily on week days.
Initial download of the metrics may take a while.