Fig. 12.
Download original image
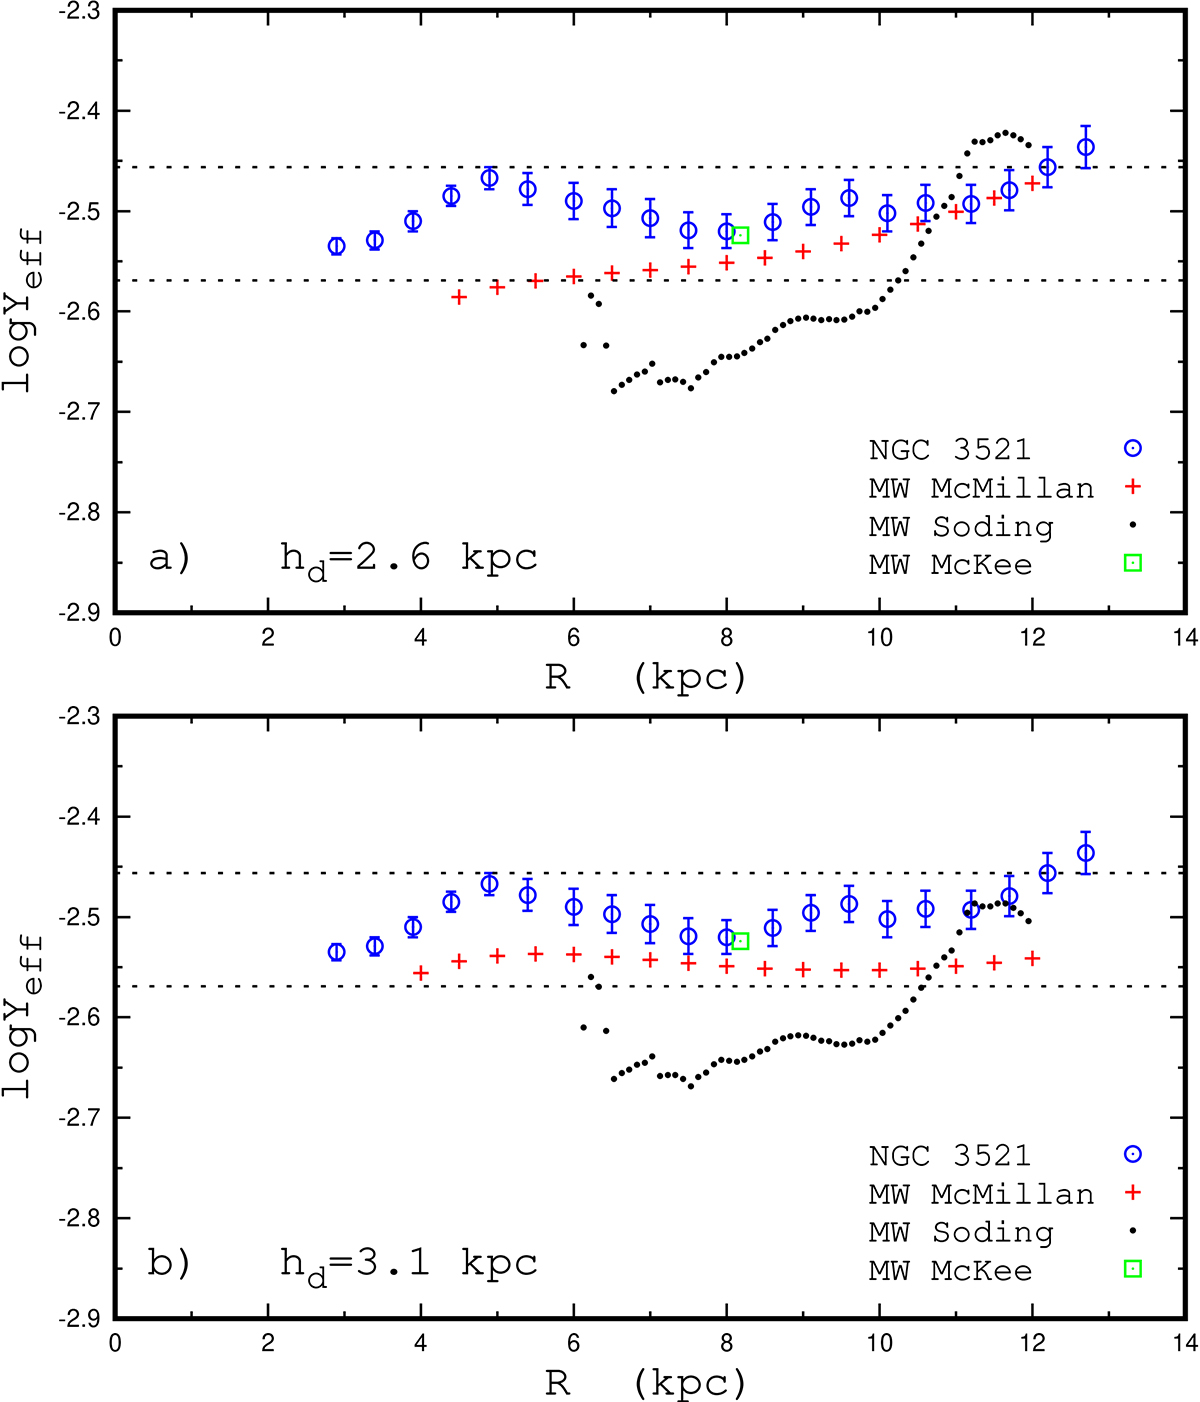
Comparison between the effective oxygen yields in the NGC 3521 and the Milky Way for the radial oxygen abundance distributions shown in Fig. 9 and the gas mass fraction distributions displied in Fig. 11. Panel a: The circles denote the effective oxygen yields in NGC 3521 as a function of radius and the bars show their uncertainties. The plus signs designate the radial distribution of the effective oxygen yields in the Milky Way based on the Σ⋆ with the stellar disc scale length of hd = 2.6 kpc and on the Σgas from McMillan (2017); the points are the yields based on the Σgas from Söding et al. (2024). The square marks the effective oxygen yield in the solar vicinity based on the Σgas from McKee et al. (2015). The lines show the upper and lower values of the empirical estimations of the oxygen yield. Panel b: Same as panel (a), but for the stellar disc scale length of hd = 3.1 kpc.
Current usage metrics show cumulative count of Article Views (full-text article views including HTML views, PDF and ePub downloads, according to the available data) and Abstracts Views on Vision4Press platform.
Data correspond to usage on the plateform after 2015. The current usage metrics is available 48-96 hours after online publication and is updated daily on week days.
Initial download of the metrics may take a while.