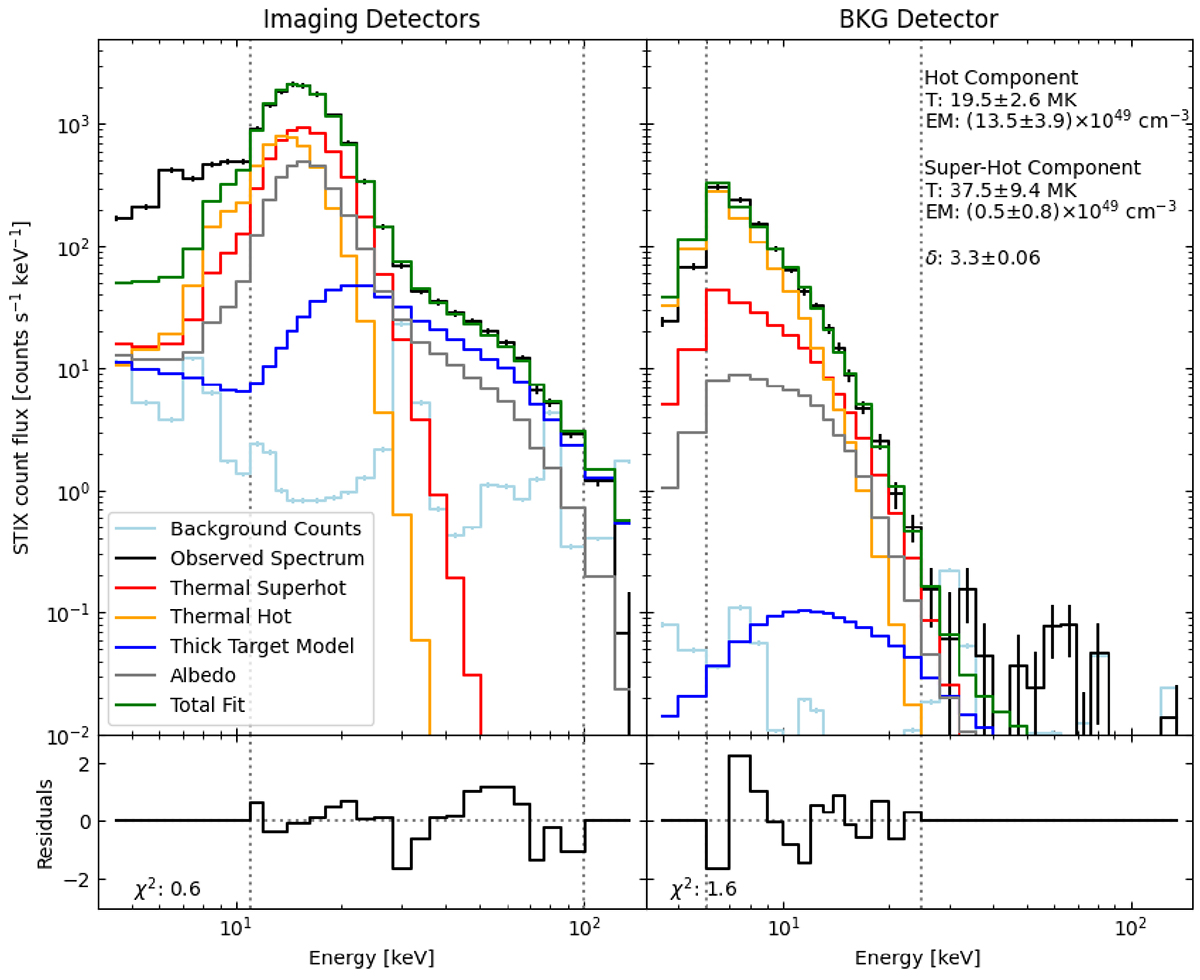
Fig. 6.
Download original image
Observed spectra measured by the imaging detectors (left) and the BKG detector with pixels 2 & 5 (right) are shown (in black). The spectra is taken in the impulsive phase during a nonthermal burst with inserted attenuator. For the imaging detectors, we fitted the energy range 11−100 keV as denoted by the vertical dotted lines. For the BKG detector, we fit the energy range 6−25 keV. In green the total fit is given with a super-hot (red) and a hot (orange) thermal model, a thick target model (blue), and the albedo (grey). The background counts are given in light blue. The plots below the spectra show the residuals of the fits.
Current usage metrics show cumulative count of Article Views (full-text article views including HTML views, PDF and ePub downloads, according to the available data) and Abstracts Views on Vision4Press platform.
Data correspond to usage on the plateform after 2015. The current usage metrics is available 48-96 hours after online publication and is updated daily on week days.
Initial download of the metrics may take a while.