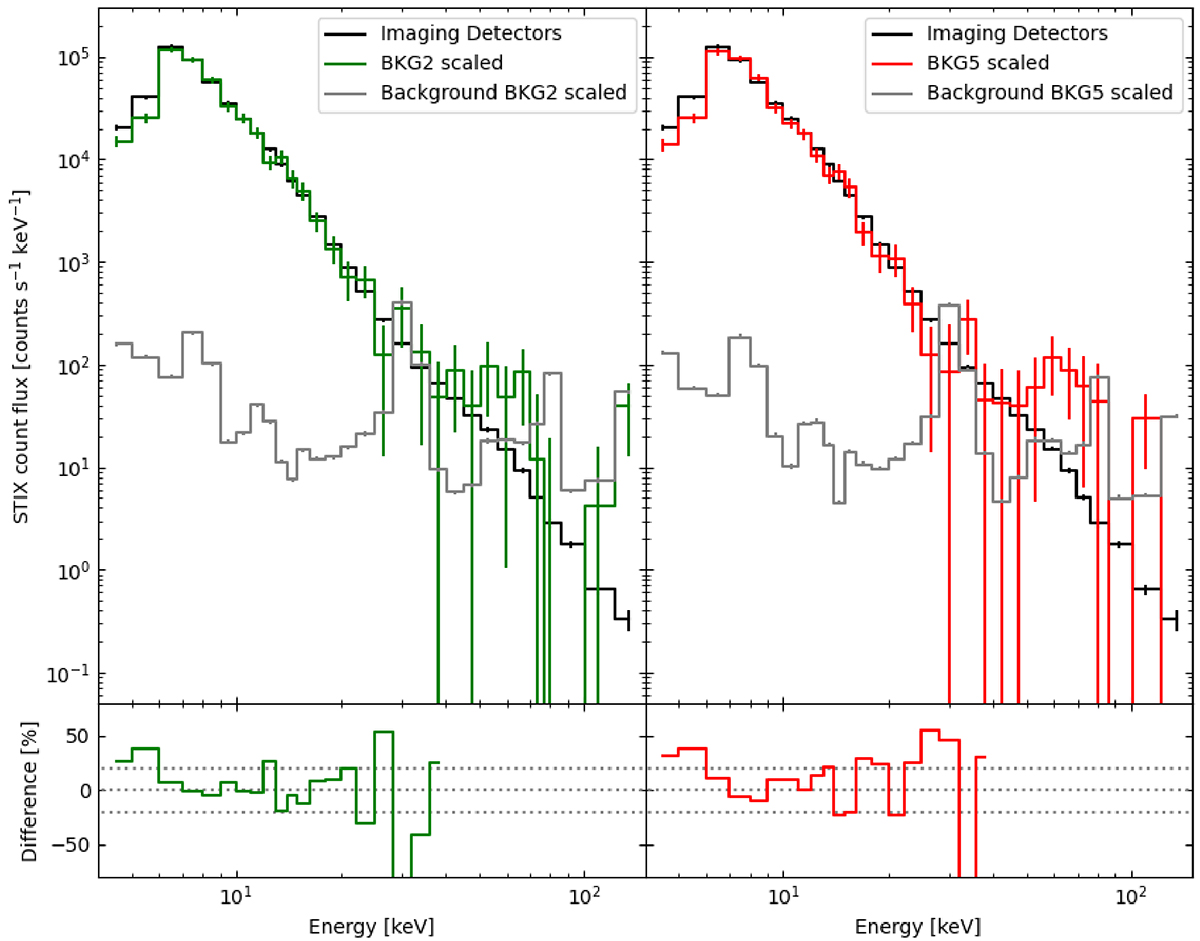
Fig. 5.
Download original image
Comparison between the observed spectra of the imaging detectors and the BKG detector of STIX. The spectra is taken during the impulsive phase of the flare shortly before the attenuator moved in. We compare pixel 2 (left) and pixel 5 (right) of the BKG detector with the 24 imaging detectors behind the coarsest grids. The units of the spectra are counts s−1 keV−1. To correct for the different areas when using 24 imaging detectors or the individual pixels of the BKG detector, we scaled the BKG detector spectra to the same area as the imaging detectors. In grey, we show the background counts of pixel 2 and 5 in the left and right plots, respectively. Below, the relative difference between the imaging detectors and the BKG detector spectra are given.
Current usage metrics show cumulative count of Article Views (full-text article views including HTML views, PDF and ePub downloads, according to the available data) and Abstracts Views on Vision4Press platform.
Data correspond to usage on the plateform after 2015. The current usage metrics is available 48-96 hours after online publication and is updated daily on week days.
Initial download of the metrics may take a while.