Fig. 3.
Download original image
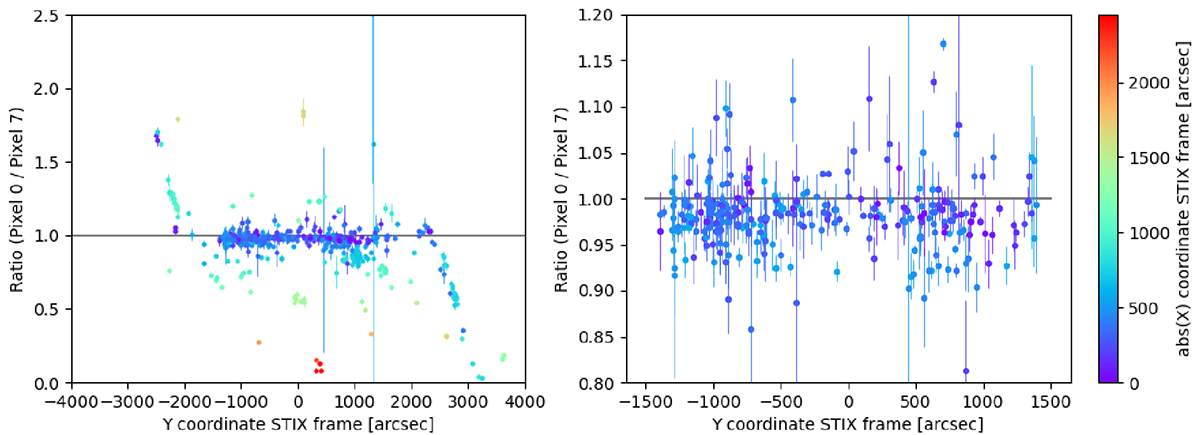
Plot of the ratio between pixel 0 and 7 (pixels behind the largest openings of the BKG detector) as a function of the flare position in the Y-coordinate of the STIX system. The color code corresponds to the flare position in the X-coordinate. The corresponding color bar is given to the right of the image. The left figure shows the result for all 500 flares, the right plot only shows the filtered flares as described in Section 3.2. The error bars are calculated using error propagation on the uncertainty of the STIX light curves. The grey lines show the expected nominal value of the ratio.
Current usage metrics show cumulative count of Article Views (full-text article views including HTML views, PDF and ePub downloads, according to the available data) and Abstracts Views on Vision4Press platform.
Data correspond to usage on the plateform after 2015. The current usage metrics is available 48-96 hours after online publication and is updated daily on week days.
Initial download of the metrics may take a while.