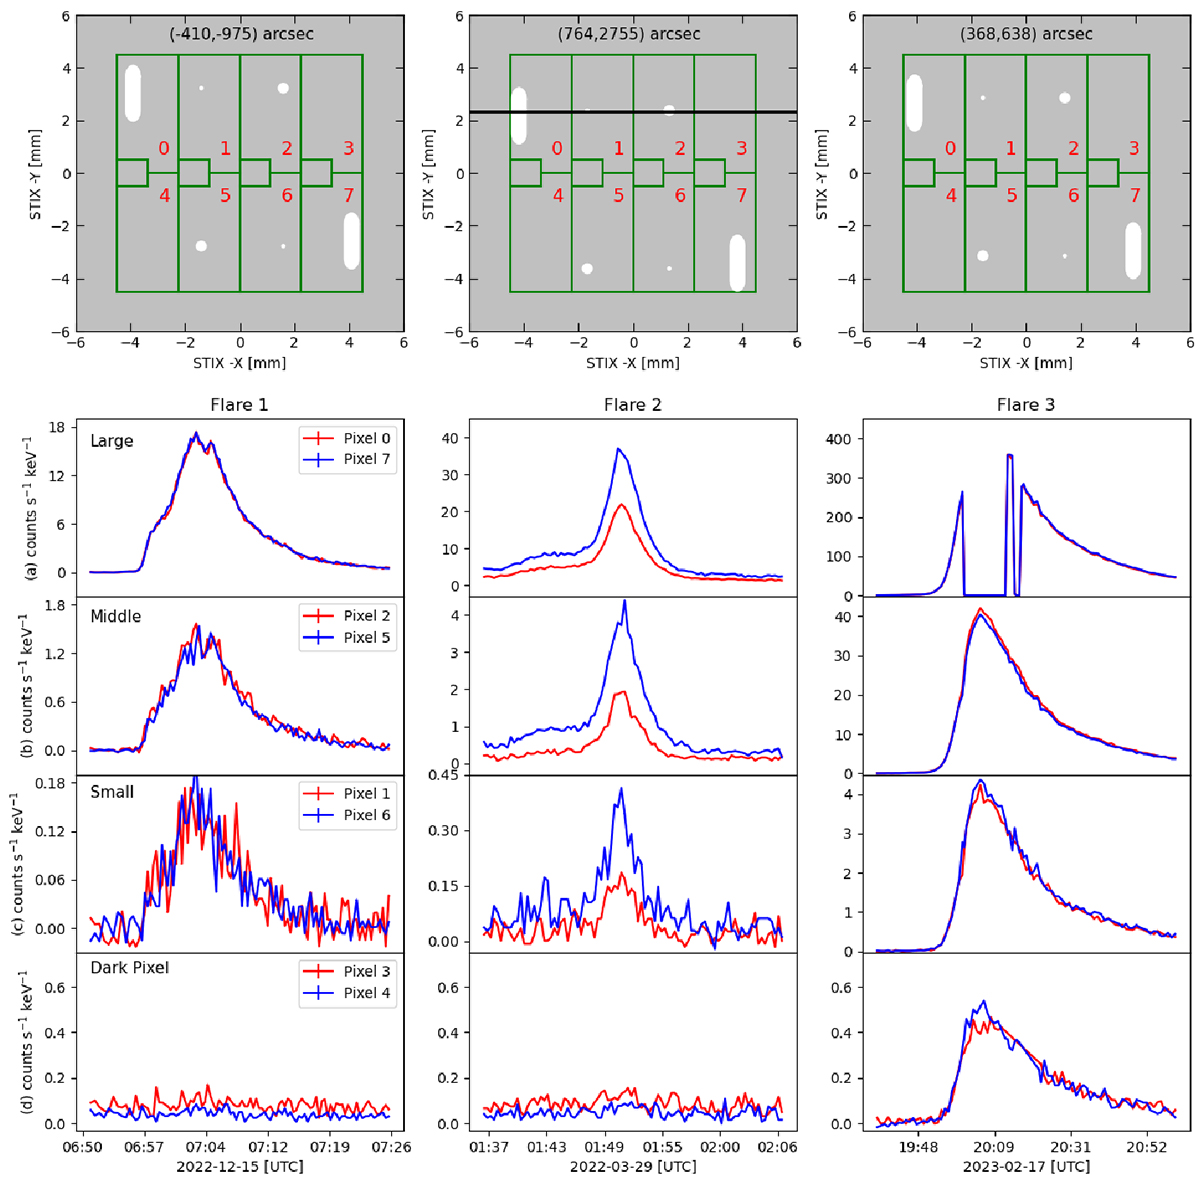
Fig. 2.
Download original image
Plotted light curves of each of the eight pixels (pixel 0−7) from the BKG detector of three different flares in the energy range of 4−10 keV. Additionally, for each flare, the rear grid of the BKG detector projected onto the pixel structure of the detector is given. The location of each flare in STIX coordinates is given above the respective detector representation. The red numbers indicate the number of the pixel. The black line for flare 2 shows the projection of the boundary of the front grid on to the rear grid. For the light curves, row (a) shows the light curves of the large apertures (pixel 0 & 7), followed by the middle (pixel 2 & 5) apertures in row (b), small (pixel 1 & 6) apertures in row (c), and last the dark pixels (pixel 3 & 4) in row (d). From left to right, we show three different flares: Flare 1 represents a standard flare, flare 2 is an off-axis flare, and flare 3 is a large flare with attenuator movement.
Current usage metrics show cumulative count of Article Views (full-text article views including HTML views, PDF and ePub downloads, according to the available data) and Abstracts Views on Vision4Press platform.
Data correspond to usage on the plateform after 2015. The current usage metrics is available 48-96 hours after online publication and is updated daily on week days.
Initial download of the metrics may take a while.