Fig. A.1.
Download original image
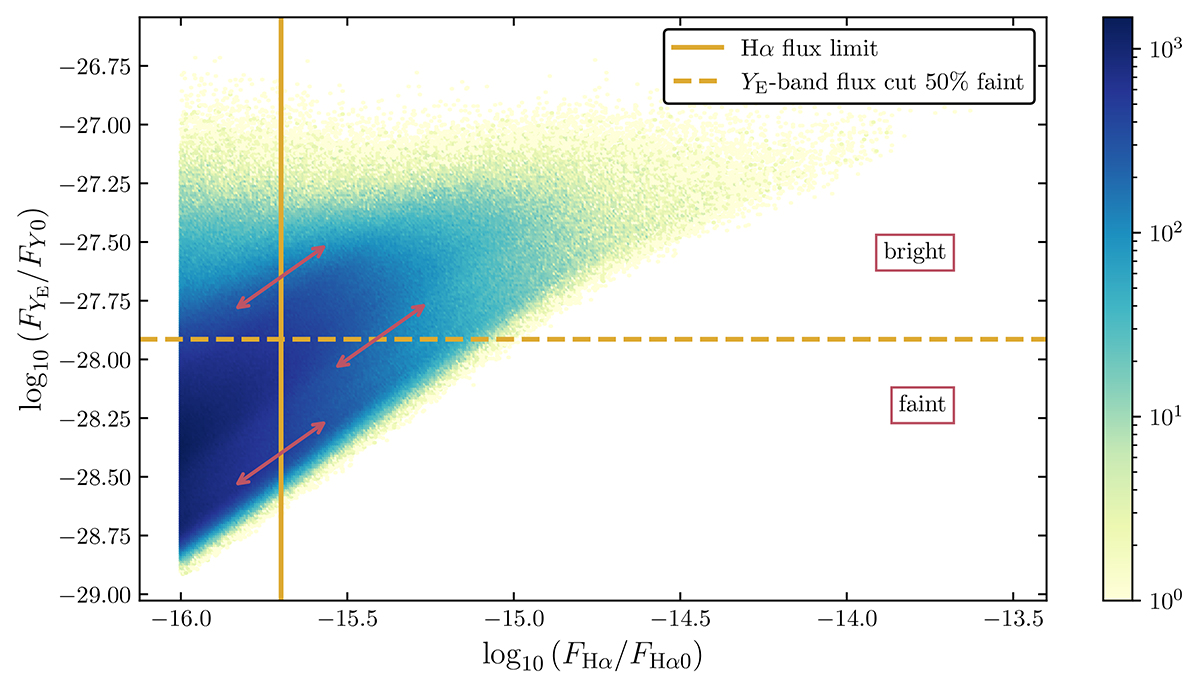
Correlation between FHα and FY for the redshift bin centred at ![]() of the Flagship spectroscopic mock catalogue. A continuous line denotes the flux limit of the Euclid Wide Survey, while a dashed line highlights a YE-band flux cut, splitting the sample in two equally-populated bright and faint populations. The reference fluxes are FHα0 = 1 erg cm−2 s−1 and FY0 ≡ 1 erg cm−2 s−1 Hz−1. The colour bar highlights the density of objects (in arbitrary units).
of the Flagship spectroscopic mock catalogue. A continuous line denotes the flux limit of the Euclid Wide Survey, while a dashed line highlights a YE-band flux cut, splitting the sample in two equally-populated bright and faint populations. The reference fluxes are FHα0 = 1 erg cm−2 s−1 and FY0 ≡ 1 erg cm−2 s−1 Hz−1. The colour bar highlights the density of objects (in arbitrary units).
Current usage metrics show cumulative count of Article Views (full-text article views including HTML views, PDF and ePub downloads, according to the available data) and Abstracts Views on Vision4Press platform.
Data correspond to usage on the plateform after 2015. The current usage metrics is available 48-96 hours after online publication and is updated daily on week days.
Initial download of the metrics may take a while.