Fig. 7.
Download original image
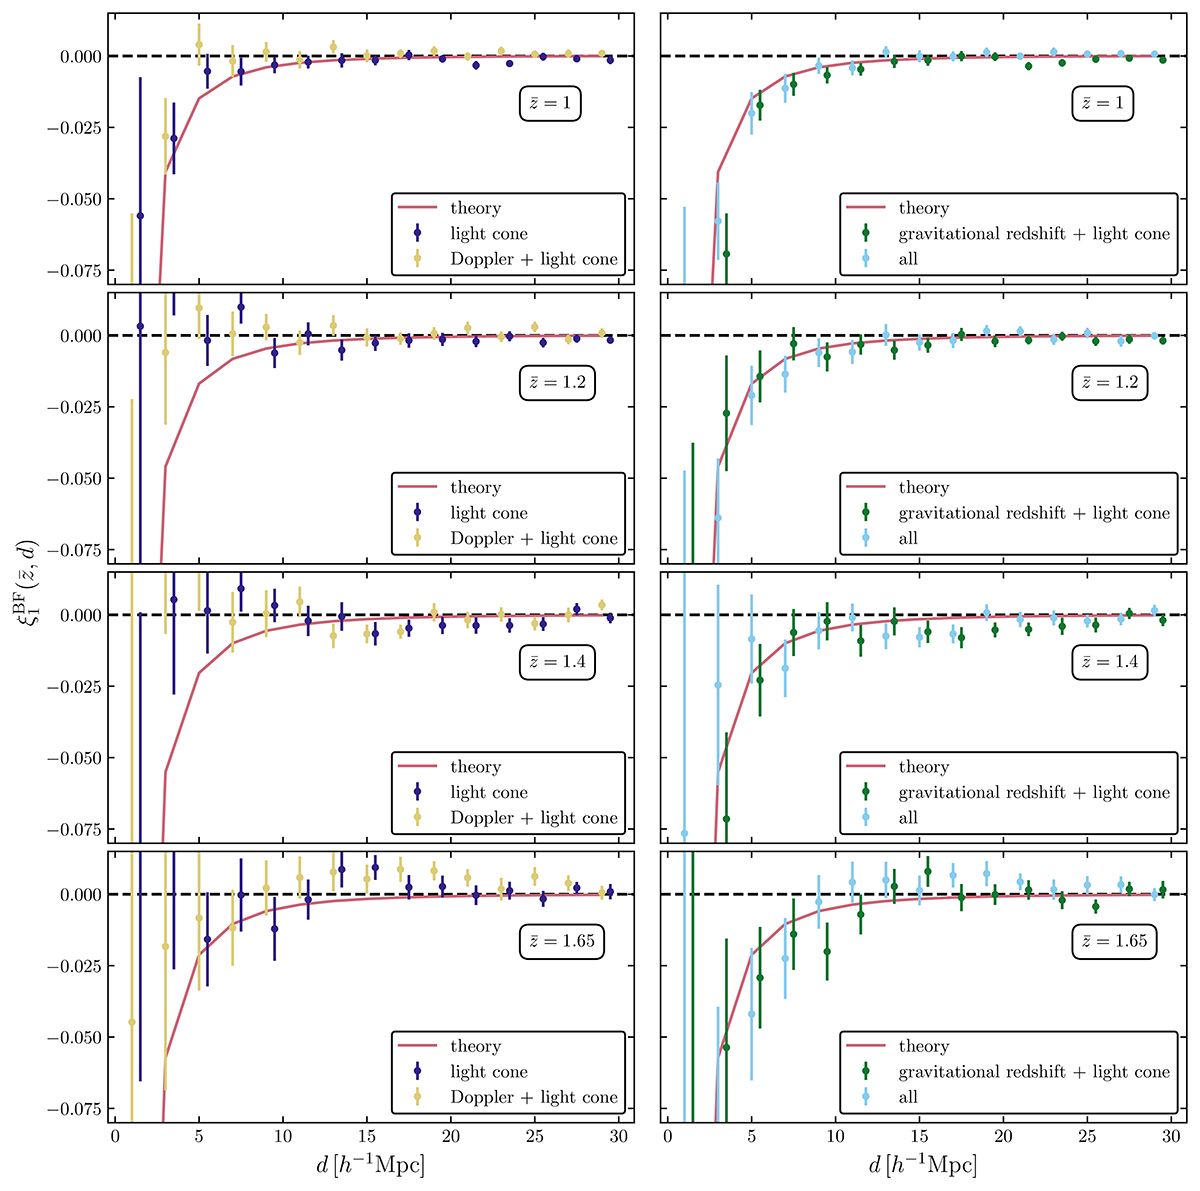
Measurements of the dipole isolating different contributions, using the 10% bright – 90% faint split. In the left panels, we show the ‘light cone’ data points from the catalogue using the background redshift to perform both selection and measurements, while ‘Doppler + light cone’ uses the redshift corrected by the peculiar velocities of the galaxies. In the right panels, ‘gravitational redshift + light cone’ uses a redshift that includes gravitational redshift but does not account for the peculiar motion of the sources, and the measurements labelled as ‘all’ include both peculiar velocities and gravitational redshift. The theory predictions (red continuous lines) represent our fiducial theory model, which incorporates linear velocities and nonlinear gravitational redshift. Rows from top to bottom correspond to measurements at redshift ![]() , respectively. The ‘light cone’ and ‘gravitational redshift + light cone’ data points have been offset by 0.5 h−1 Mpc along the d-axis for better visualisation.
, respectively. The ‘light cone’ and ‘gravitational redshift + light cone’ data points have been offset by 0.5 h−1 Mpc along the d-axis for better visualisation.
Current usage metrics show cumulative count of Article Views (full-text article views including HTML views, PDF and ePub downloads, according to the available data) and Abstracts Views on Vision4Press platform.
Data correspond to usage on the plateform after 2015. The current usage metrics is available 48-96 hours after online publication and is updated daily on week days.
Initial download of the metrics may take a while.