Open Access
Fig. 4.
Download original image
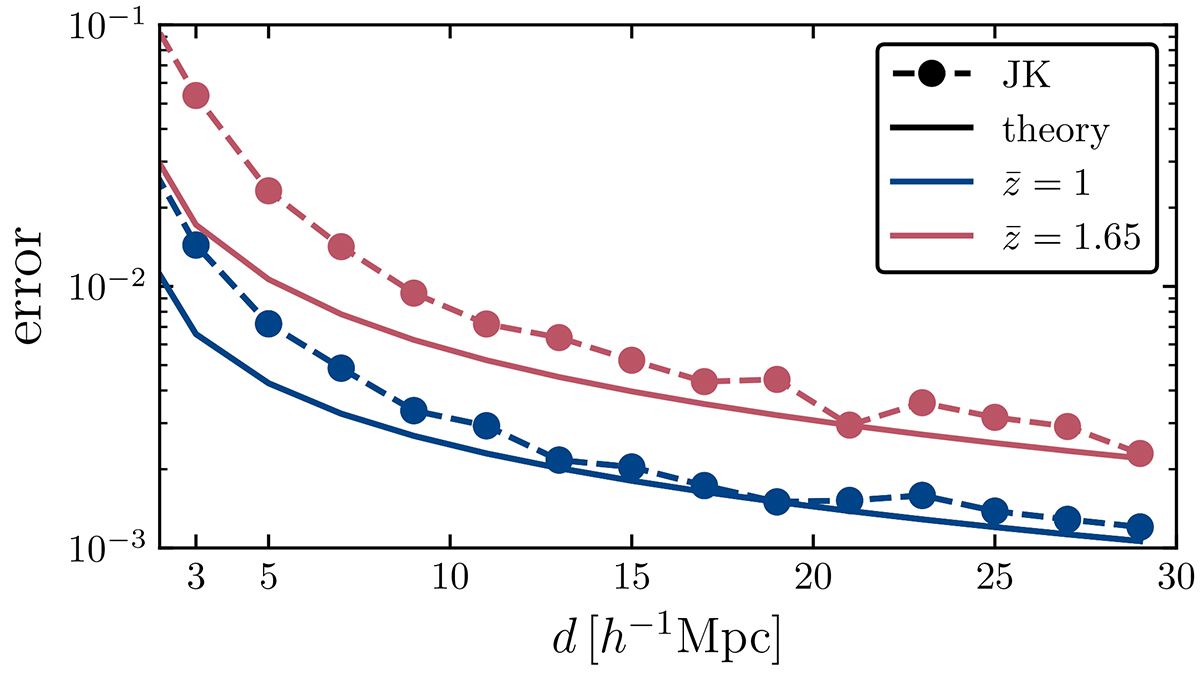
Comparison of the uncertainty estimate from the theory covariance (continuous lines) and numerical covariance, computed from the mock using the JK resampling method (data points). We consider the two representative redshift bins centred at ![]() (in blue) and
(in blue) and ![]() (in red). Both estimates use a split of 90% faint and 10% bright.
(in red). Both estimates use a split of 90% faint and 10% bright.
Current usage metrics show cumulative count of Article Views (full-text article views including HTML views, PDF and ePub downloads, according to the available data) and Abstracts Views on Vision4Press platform.
Data correspond to usage on the plateform after 2015. The current usage metrics is available 48-96 hours after online publication and is updated daily on week days.
Initial download of the metrics may take a while.