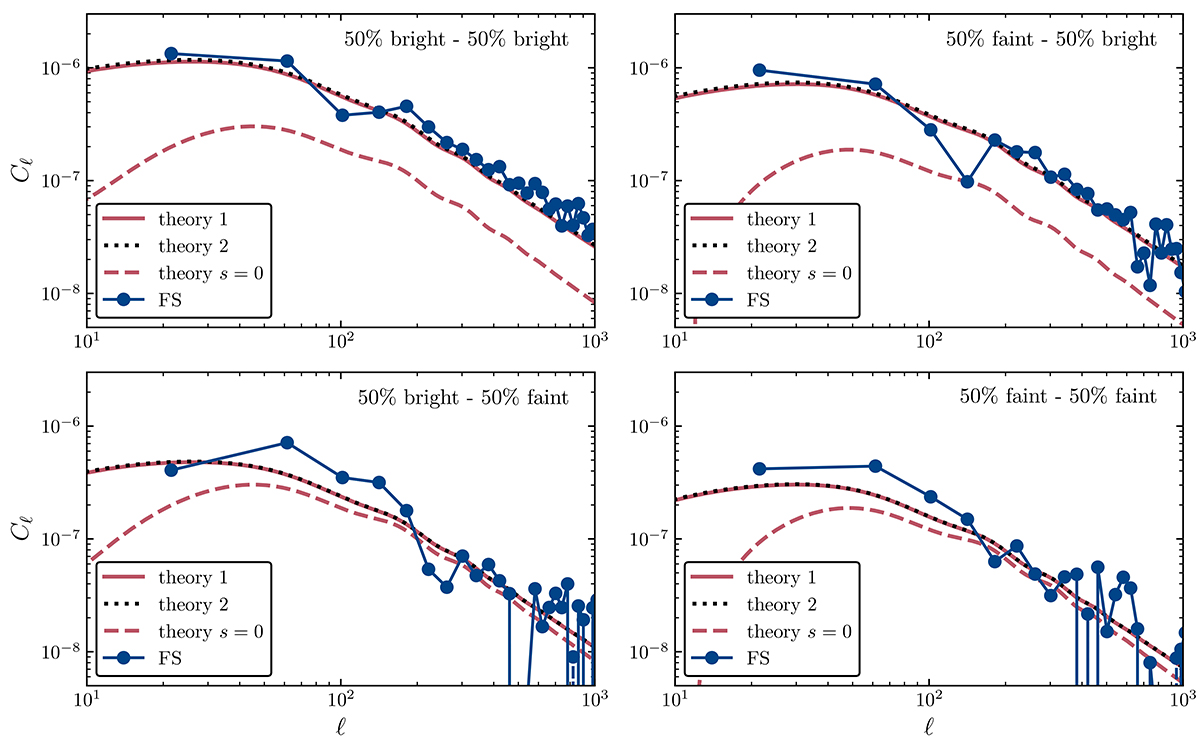
Fig. A.2.
Download original image
Angular power spectra for split 1 (50% of bright galaxies and 50% of faint galaxies). Each panel represents a combination of maps: the top-left panel is the cross-correlation of the two number count maps of the bright sample, the top-right panel is the cross-correlation of the faint sample map at low redshift with the bright sample map at high redshift (both sensitive to the local count slope of the bright population), the bottom-left panel is the cross-correlation of the bright sample map at low redshift with the faint sample map at high redshift, and the bottom-right panel is the cross-correlation of the two number count maps of the faint sample (both sensitive to the local count slope of the faint population). Data points represent simulation measurements, using the estimator defined in Eq. (A.14). Continuous red lines show the theory prediction using the analytical formula derived in this section for the local count slope, and black dotted lines are the predictions obtained from the values of the local count slope computed using the numerical differentiation method described in the text. A dashed line shows the absolute value of the theory model obtained with a local count slope equal to zero, that is, assuming no flux magnification (their true values are negative).
Current usage metrics show cumulative count of Article Views (full-text article views including HTML views, PDF and ePub downloads, according to the available data) and Abstracts Views on Vision4Press platform.
Data correspond to usage on the plateform after 2015. The current usage metrics is available 48-96 hours after online publication and is updated daily on week days.
Initial download of the metrics may take a while.