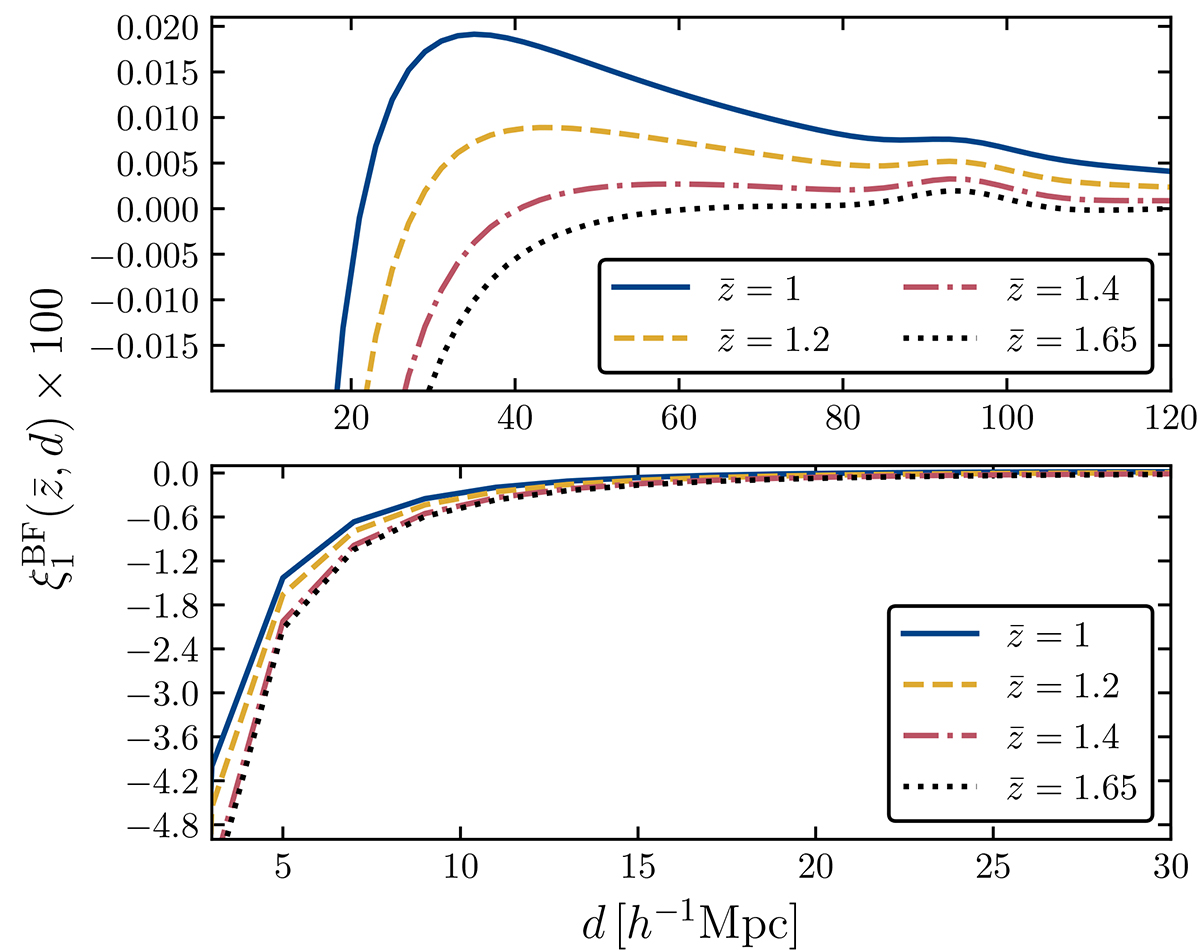
Fig. 1.
Download original image
Dipole model, including the contribution from nonlinear gravitational redshift. The top panel includes linear scales up to 120 h−1 Mpc, while the bottom panel is a zoom-in of the observable on nonlinear scales, up to 30 h−1 Mpc. In the two panels, we use a different range to display the dipole model for better visualization: the dipole amplitude is significantly larger on small scales. Specifics are taken from Table B.1, using the split 90% faint, 10% bright. Top and bottom panels focus on the large-scale and small-scale dipole predictions, respectively.
Current usage metrics show cumulative count of Article Views (full-text article views including HTML views, PDF and ePub downloads, according to the available data) and Abstracts Views on Vision4Press platform.
Data correspond to usage on the plateform after 2015. The current usage metrics is available 48-96 hours after online publication and is updated daily on week days.
Initial download of the metrics may take a while.