Fig. 8.
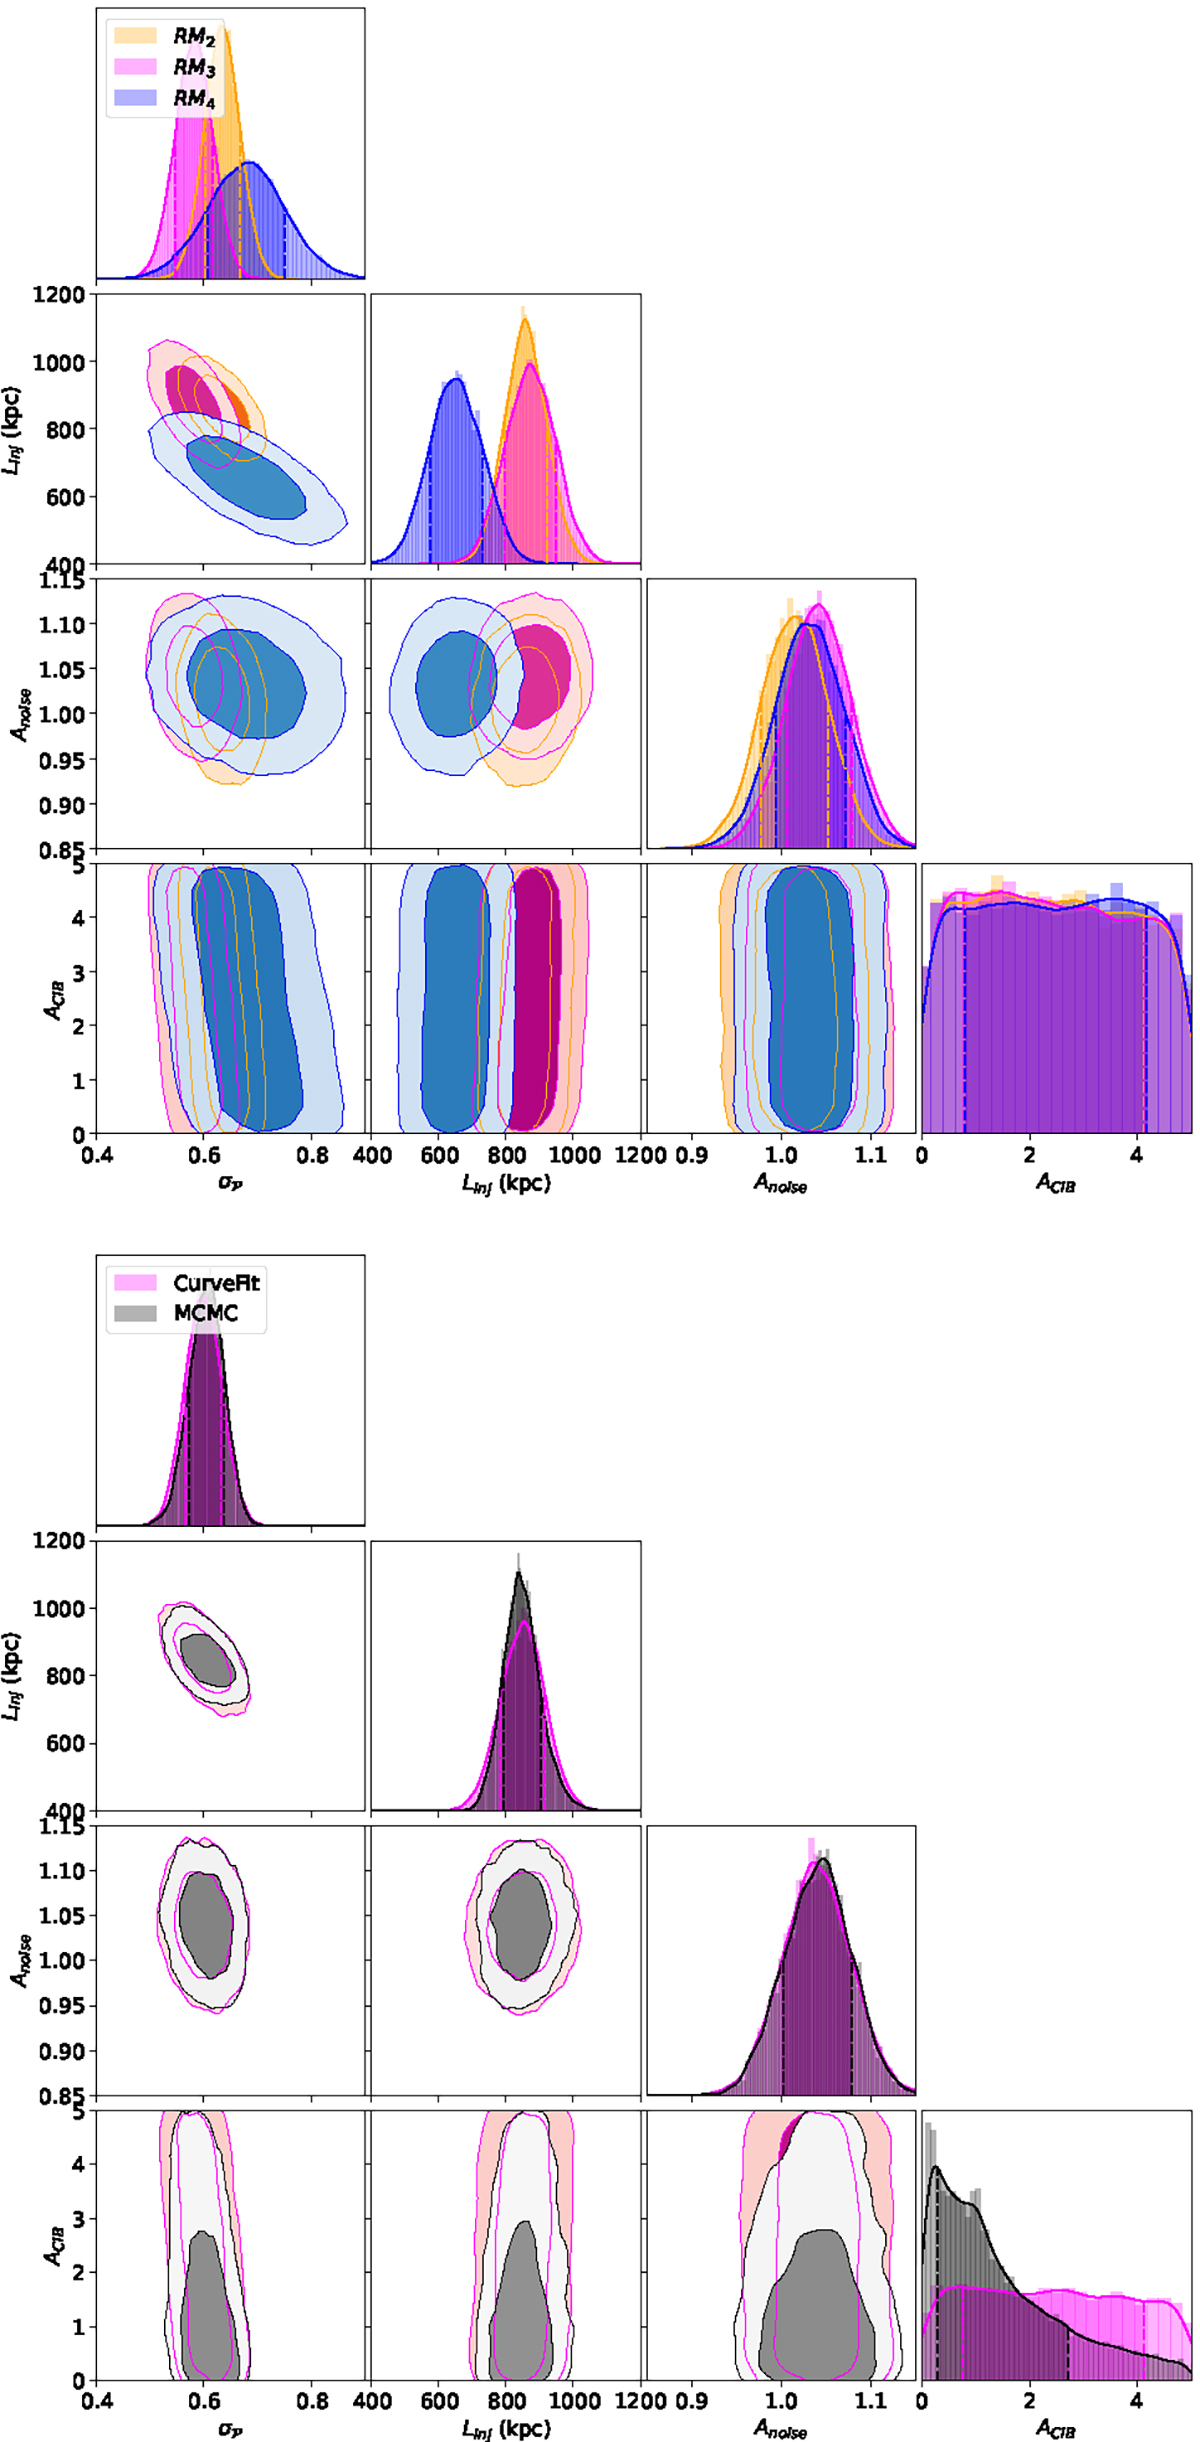
Download original image
Top: constraints in the parameter space for models RM2, RM3 and RM4. Other extreme models are not shown for clarity. Contours correspond to the 68 and 95% confidence intervals. Bottom: comparison between the constraints obtained on RM3 for the full MCMC sampling and the non linear least square approximation methods, in the case of RM3.
Current usage metrics show cumulative count of Article Views (full-text article views including HTML views, PDF and ePub downloads, according to the available data) and Abstracts Views on Vision4Press platform.
Data correspond to usage on the plateform after 2015. The current usage metrics is available 48-96 hours after online publication and is updated daily on week days.
Initial download of the metrics may take a while.