Fig. 5.
Download original image
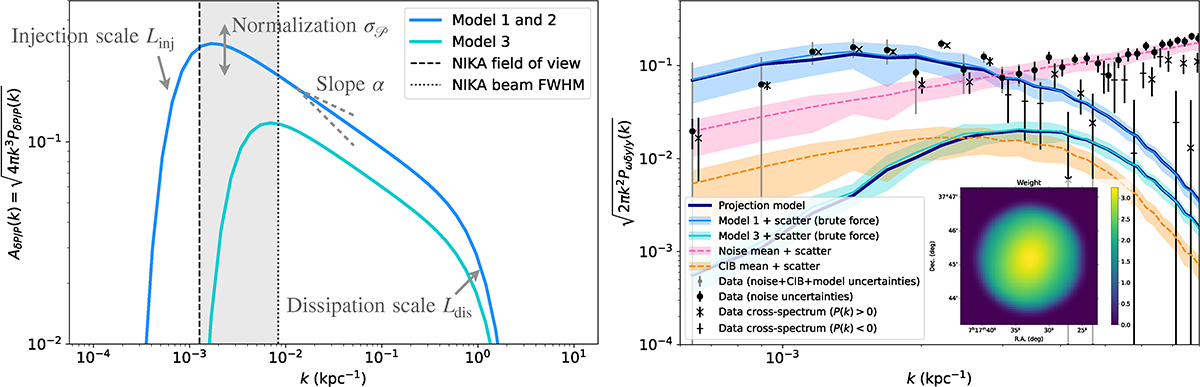
Input pressure fluctuation power spectrum and its 2D projection. Left: input 3D pressure fluctuations power spectra for model 1, 2, and 3. The grey area roughly corresponds to the observable modes with the NIKA data. Right: 2D SZ fluctuations power spectra for MACS J0717.5+3745 NIKA data, the noise contribution, the CIB contribution, and models 1 and 3 including the projection and brute force approaches. The shaded area corresponds to the measured standard deviation of the respective spectra. For the data, error bars indicate the contribution from the noise and CIB only in black, and account for the intrinsic scatter of model 1 in grey. We show both the auto spectrum of the full data, and the cross spectra of two independent data subsets. For the later, the power spectrum may be negative, as indicate in the legend. The uncertainties due to the noise are ![]() larger for the cross spectrum than for the auto spectrum.
larger for the cross spectrum than for the auto spectrum.
Current usage metrics show cumulative count of Article Views (full-text article views including HTML views, PDF and ePub downloads, according to the available data) and Abstracts Views on Vision4Press platform.
Data correspond to usage on the plateform after 2015. The current usage metrics is available 48-96 hours after online publication and is updated daily on week days.
Initial download of the metrics may take a while.