Fig. 4.
Download original image
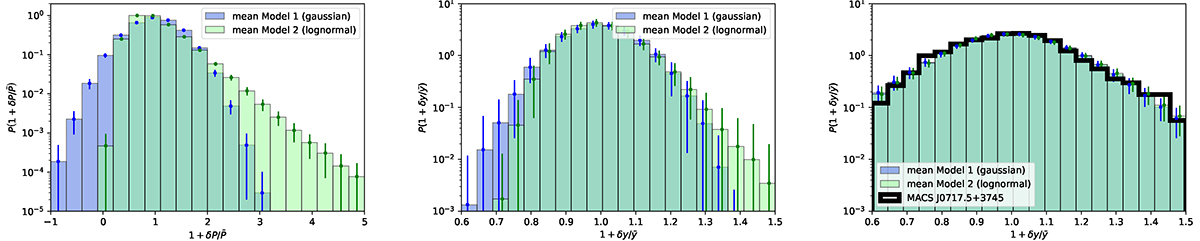
Comparison between the pressure and 1D SZ fluctuations probability distributions for model 1 (gaussian) and model 2 (lognormal), and MACS J0717.5+3745 data. Left: probability density function of the pressure fluctuations ![]() for model 1 (gaussian fluctuations) and model 2 (lognormal fluctuations). Middle: probability density function of the SZ fluctuations
for model 1 (gaussian fluctuations) and model 2 (lognormal fluctuations). Middle: probability density function of the SZ fluctuations ![]() for model 1 and model 2, without noise. Right: probability density function of the SZ fluctuations
for model 1 and model 2, without noise. Right: probability density function of the SZ fluctuations ![]() for model 1 and model 2, including noise, and comparison with MACS J0717.5+3745 NIKA data. The data and model were smoothed with a 10 arcsec FWHM gaussian kernel to reduce the noise. The mean distributions and error bars were obtained from the mean and standard deviations, respectively, of 100 Monte Carlo realizations.
for model 1 and model 2, including noise, and comparison with MACS J0717.5+3745 NIKA data. The data and model were smoothed with a 10 arcsec FWHM gaussian kernel to reduce the noise. The mean distributions and error bars were obtained from the mean and standard deviations, respectively, of 100 Monte Carlo realizations.
Current usage metrics show cumulative count of Article Views (full-text article views including HTML views, PDF and ePub downloads, according to the available data) and Abstracts Views on Vision4Press platform.
Data correspond to usage on the plateform after 2015. The current usage metrics is available 48-96 hours after online publication and is updated daily on week days.
Initial download of the metrics may take a while.