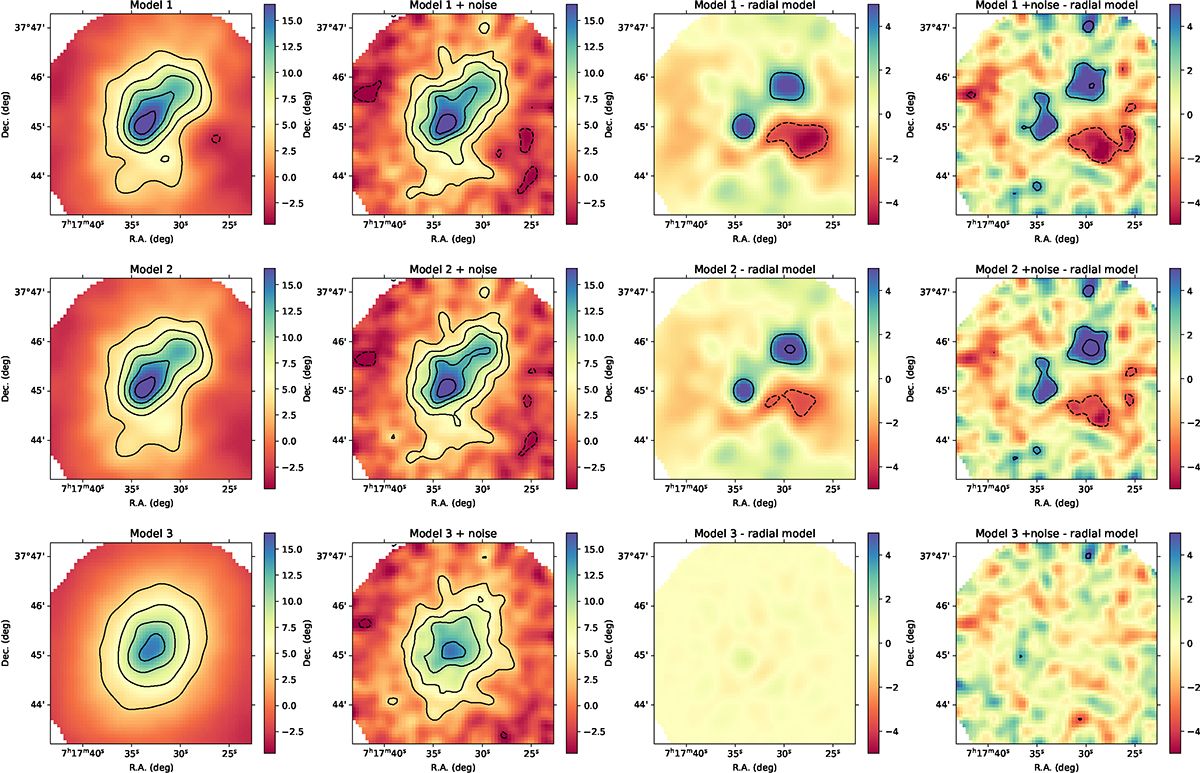
Fig. 3.
Download original image
Simulated SZ mocks to be compared with the NIKA data (Figure 2). The smoothing kernel and the contours are the same as Figure 2. From left to right, we show a noiseless SZ realization, the same image with noise, the noiseless residual between the mock and the radial model, and the residual including noise. The first, second and third rows correspond to model 1, model 2 and model 3, respectively. See Table 1 for the definition of the models.
Current usage metrics show cumulative count of Article Views (full-text article views including HTML views, PDF and ePub downloads, according to the available data) and Abstracts Views on Vision4Press platform.
Data correspond to usage on the plateform after 2015. The current usage metrics is available 48-96 hours after online publication and is updated daily on week days.
Initial download of the metrics may take a while.