Fig. 2.
Download original image
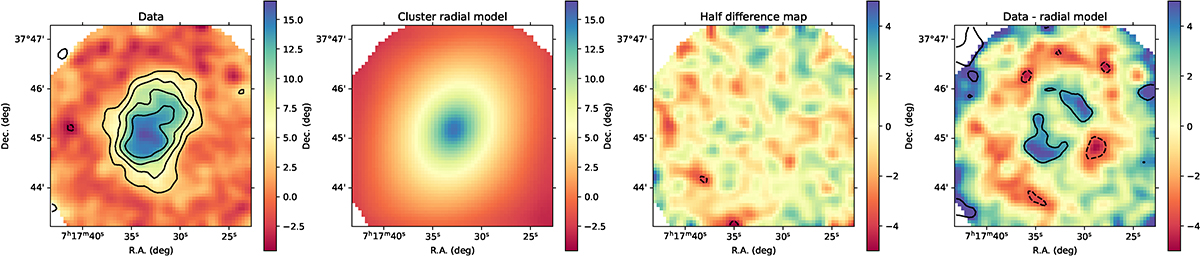
NIKA Compton parameter (y) data. From left to right, we show the NIKA MACS J0717.5+3705 input data, its best-fit radial model map, a jackknife map (half difference between two equal data subsets) and the residual between the data and the radial model, δy. The data were smoothed with a 15 arcsec gaussian kernel (FWHM) for visual purposes. The contours are showing the S/N in units of 3σ. The comparison with mock data can be observed in Figure 3.
Current usage metrics show cumulative count of Article Views (full-text article views including HTML views, PDF and ePub downloads, according to the available data) and Abstracts Views on Vision4Press platform.
Data correspond to usage on the plateform after 2015. The current usage metrics is available 48-96 hours after online publication and is updated daily on week days.
Initial download of the metrics may take a while.