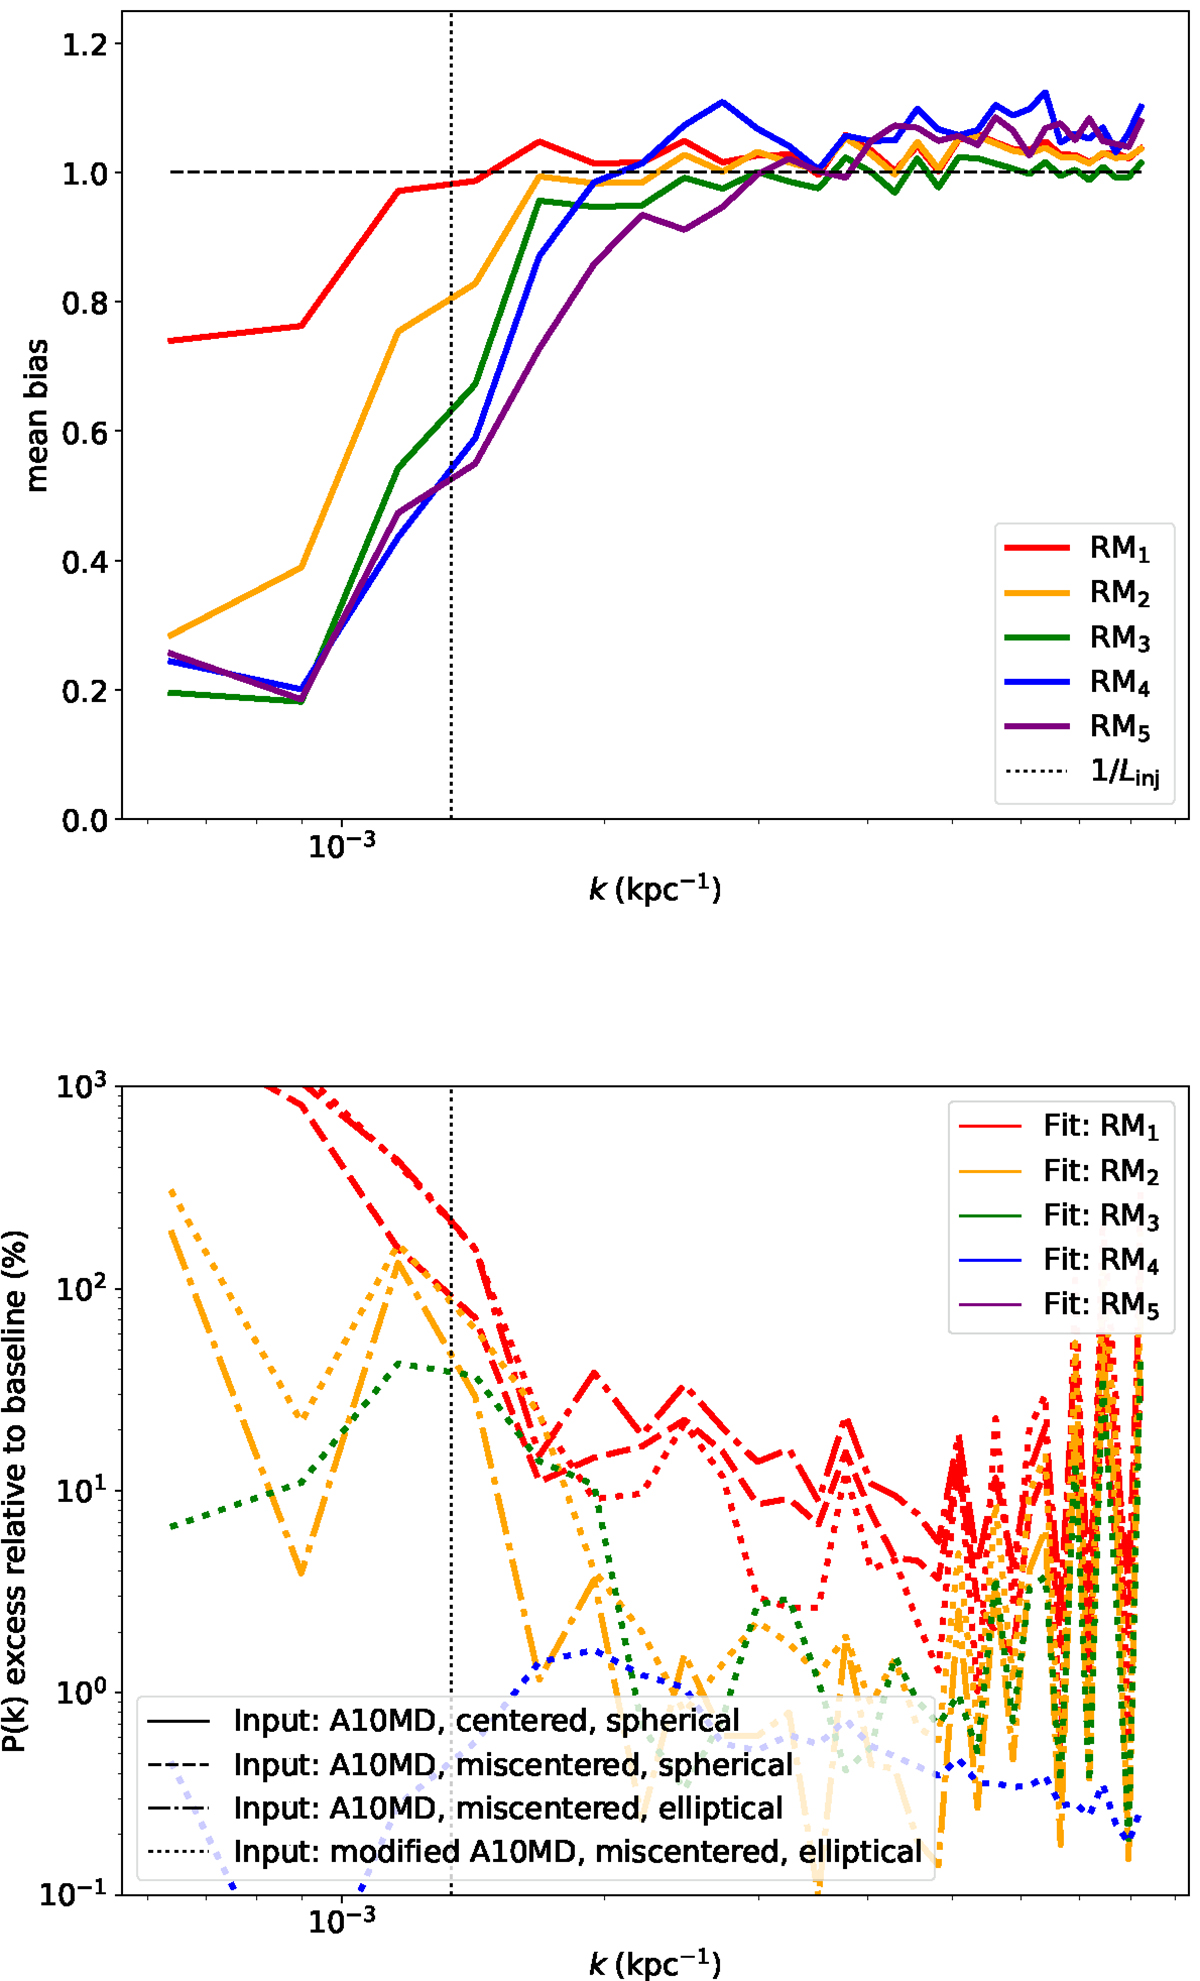
Fig. C.1.
Download original image
Estimate of the bias induced by the radial model as a function of wavenumber. Top: bias induced by the removal of fluctuations implied by the fit of the radial model (Equation C.1). Bottom: excess fluctuations induced by the mismodelling, relative to a reference pressure fluctuation power spectrum (σ𝒫 = 0.5, Linj = 750 kpc, α = −11/3 and Ldis = 1 kpc). The different colours represent the different models, according to Section 5.1. In the right panel, the different line styles refer to the different input radial model. In both panels, the vertical dashed line gives k = 1/Linj.
Current usage metrics show cumulative count of Article Views (full-text article views including HTML views, PDF and ePub downloads, according to the available data) and Abstracts Views on Vision4Press platform.
Data correspond to usage on the plateform after 2015. The current usage metrics is available 48-96 hours after online publication and is updated daily on week days.
Initial download of the metrics may take a while.