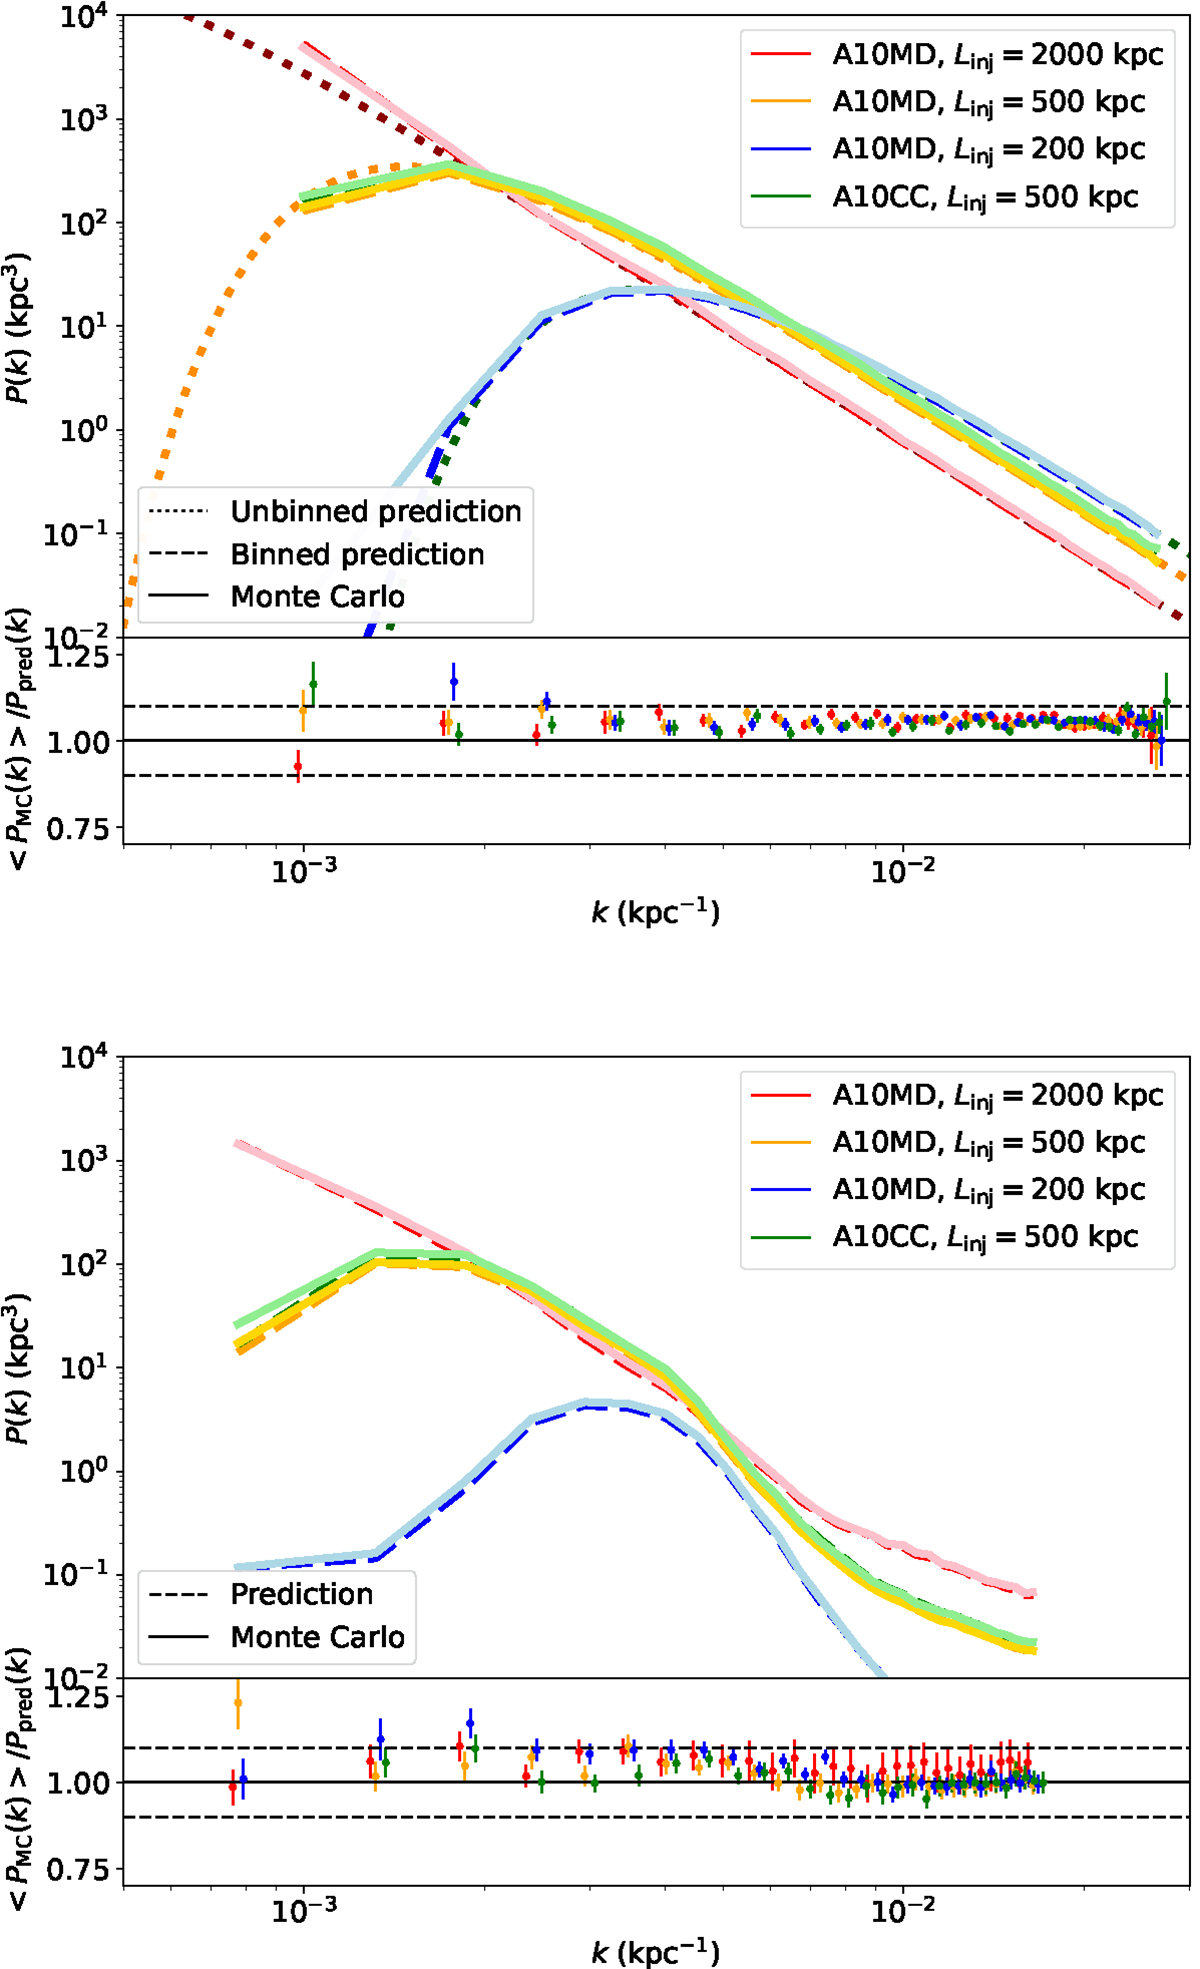
Fig. B.1.
Download original image
Comparison between the expected and the recovered (mean of Monte Carlo realizations) pressure fluctuation power spectra. The bias, shown at the bottom of each panel, is defined as the ratio between the two and we show the ±10% interval as a dashed line. Error bars correspond to the uncertainties on the mean associated with the variability of Monte Carlo realizations. Top: comparison after projection only, i.e. we are testing the validity of Equation 13. The bias is larger than a factor of 1.3 only for the lowest bin for the blue curve, at scales well above the peak. Bottom: comparison when including projection effects, the instrument response function and masking, i.e. we are testing the framework discussed in Section 4. The labels A10MD and A10CC refer to the morphologically disturbed and cool-core pressure profile models of Arnaud et al. (2010), respectively.
Current usage metrics show cumulative count of Article Views (full-text article views including HTML views, PDF and ePub downloads, according to the available data) and Abstracts Views on Vision4Press platform.
Data correspond to usage on the plateform after 2015. The current usage metrics is available 48-96 hours after online publication and is updated daily on week days.
Initial download of the metrics may take a while.