Fig. 10.
Download original image
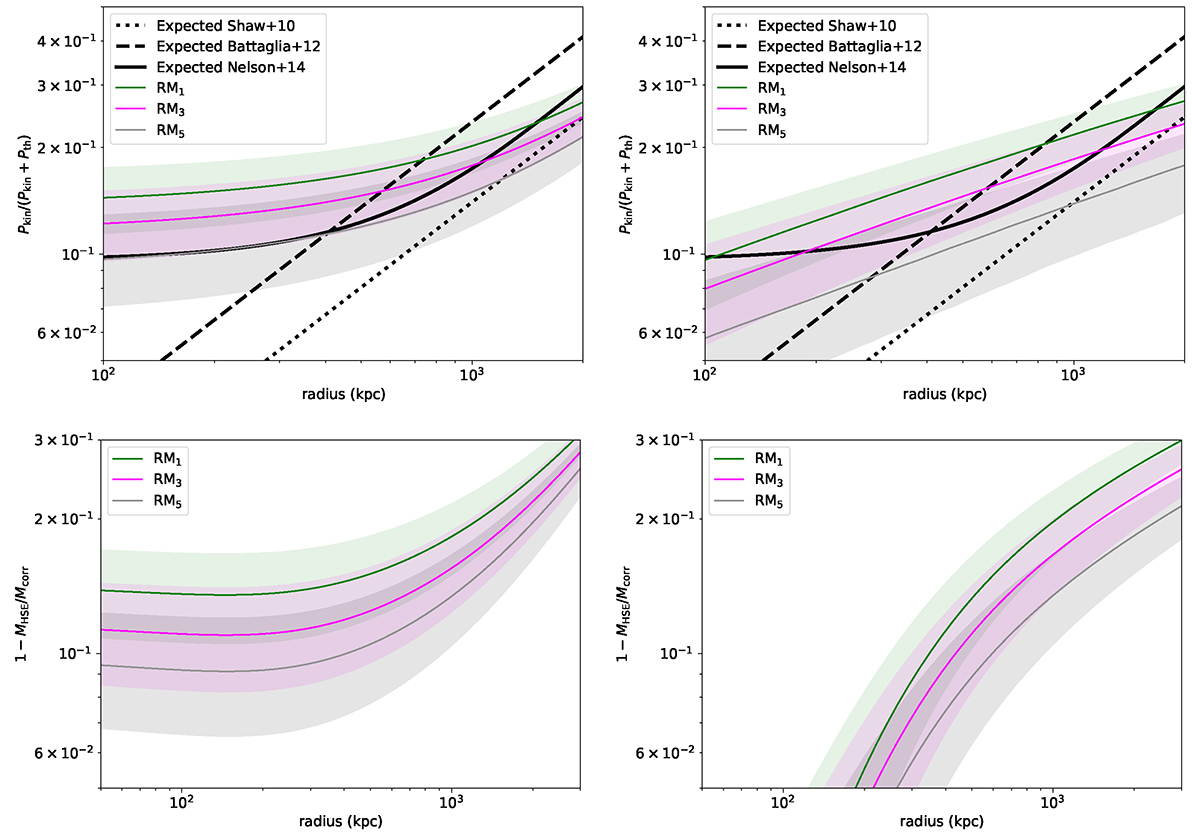
Kinetic to thermal plus kinetic pressure ratio and hydrostatic mass bias as a function of radius. Constraints are obtained using the scaling relation of Zhuravleva et al. (2023) given in Equation (26) (sum, left panel) and Equation (27) (product, right panel). Error contours account for the statistical uncertainties in the power spectrum measures and the scatter in the relation by Zhuravleva et al. (2023). Top: kinetic to thermal plus kinetic pressure ratio constraint and comparison to expectations from numerical simulations (Shaw et al. 2010; Battaglia et al. 2012; Nelson et al. 2014). Here we assumed M500 = 26.5 × 10¹⁴ M⊙ according to the result from model RM3, but this choice does not significantly affect our results. Bottom: hydrostatic mass bias profile computed as ![]() . The results from RM2 and RM4 were omitted for clarity, but they lie between models RM1 and RM3, and RM3 and RM5, respectively.
. The results from RM2 and RM4 were omitted for clarity, but they lie between models RM1 and RM3, and RM3 and RM5, respectively.
Current usage metrics show cumulative count of Article Views (full-text article views including HTML views, PDF and ePub downloads, according to the available data) and Abstracts Views on Vision4Press platform.
Data correspond to usage on the plateform after 2015. The current usage metrics is available 48-96 hours after online publication and is updated daily on week days.
Initial download of the metrics may take a while.