Fig. 1.
Download original image
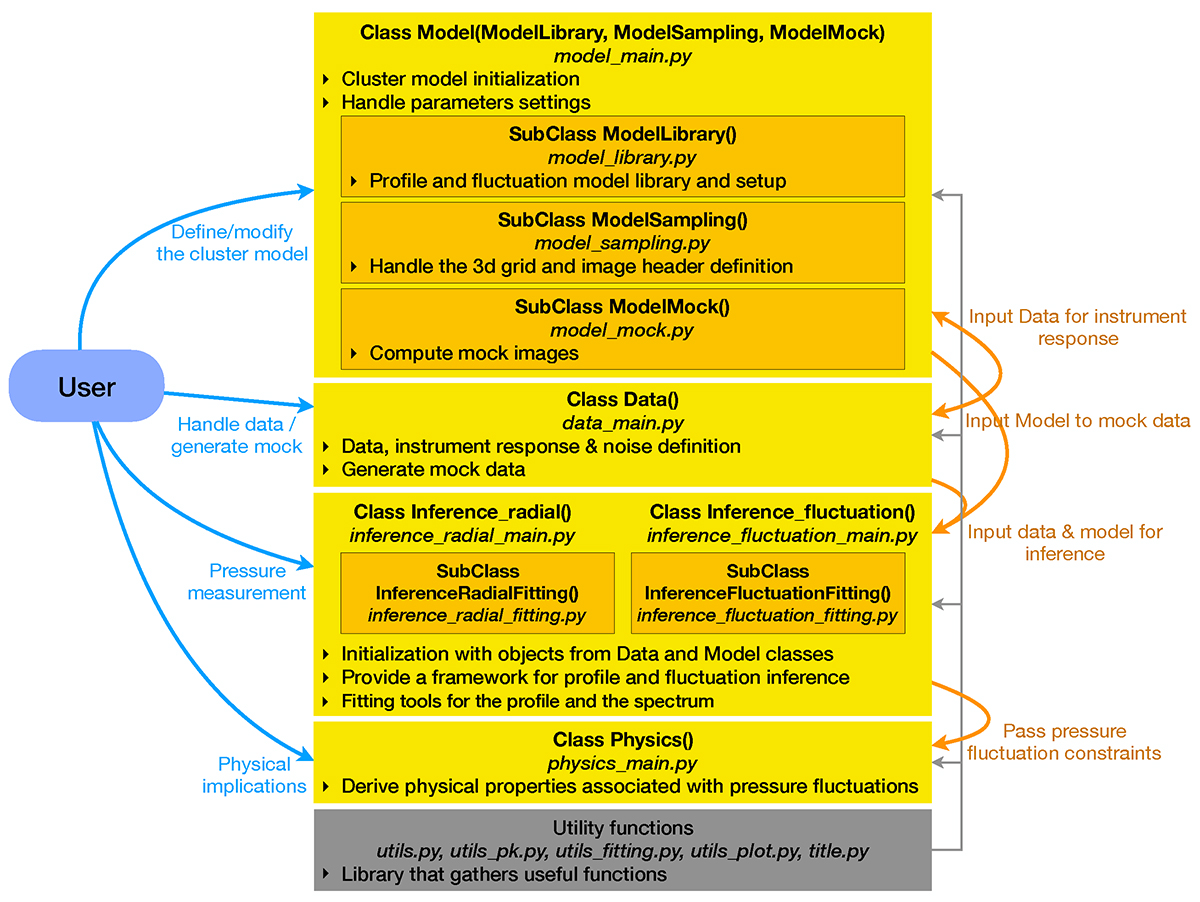
Overview of the code structure, user interfaces, and links between the different components. The yellow boxes display the main classes and the inner orange boxes indicate the dependence on the main sub-classes, with class names indicated at the top together with the name of the main file where this is defined. The grey box gives the name of the utility function files. The blue arrows indicate the interfaces with the user. The orange arrows indicate how the different modules are inputs to one another. The grey arrows show how utility functions are used by the classes.
Current usage metrics show cumulative count of Article Views (full-text article views including HTML views, PDF and ePub downloads, according to the available data) and Abstracts Views on Vision4Press platform.
Data correspond to usage on the plateform after 2015. The current usage metrics is available 48-96 hours after online publication and is updated daily on week days.
Initial download of the metrics may take a while.