Fig. 9
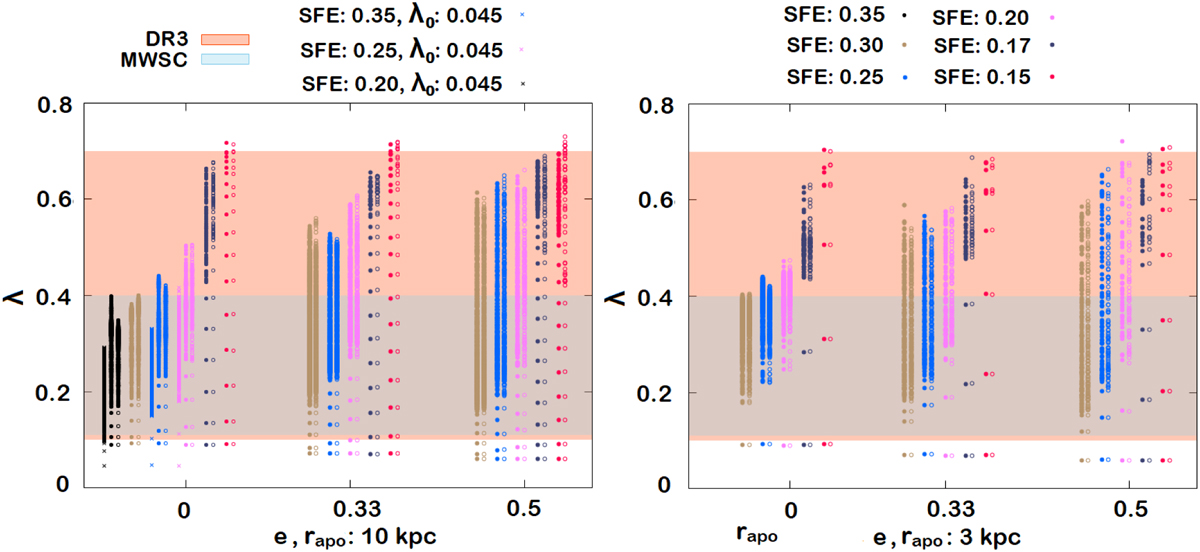
Download original image
Evolution (vertical points) of clusters’ Roche-volume filling factors − λ as a function of orbital eccentricities e = 0, 0.33, 0.5 for the two values of orbital apocentres rapo = 10 and 3 kpc. With different coloured circles we represent the different values of global SFE. All the basic runs start with the default λ0 = 0.09. Additionally, the set of three runs with the two-times smaller λ0 = 0.045 presented with the crosses. Filled circles represent the planar orbits (Z = 0), while non-filled circles represent the non-planar orbits. The range of the observed λ based on the OC data from Gaia DR3 is shown in light red, and the MWSC catalogue is shown in light blue.
Current usage metrics show cumulative count of Article Views (full-text article views including HTML views, PDF and ePub downloads, according to the available data) and Abstracts Views on Vision4Press platform.
Data correspond to usage on the plateform after 2015. The current usage metrics is available 48-96 hours after online publication and is updated daily on week days.
Initial download of the metrics may take a while.