Fig. 8
Download original image
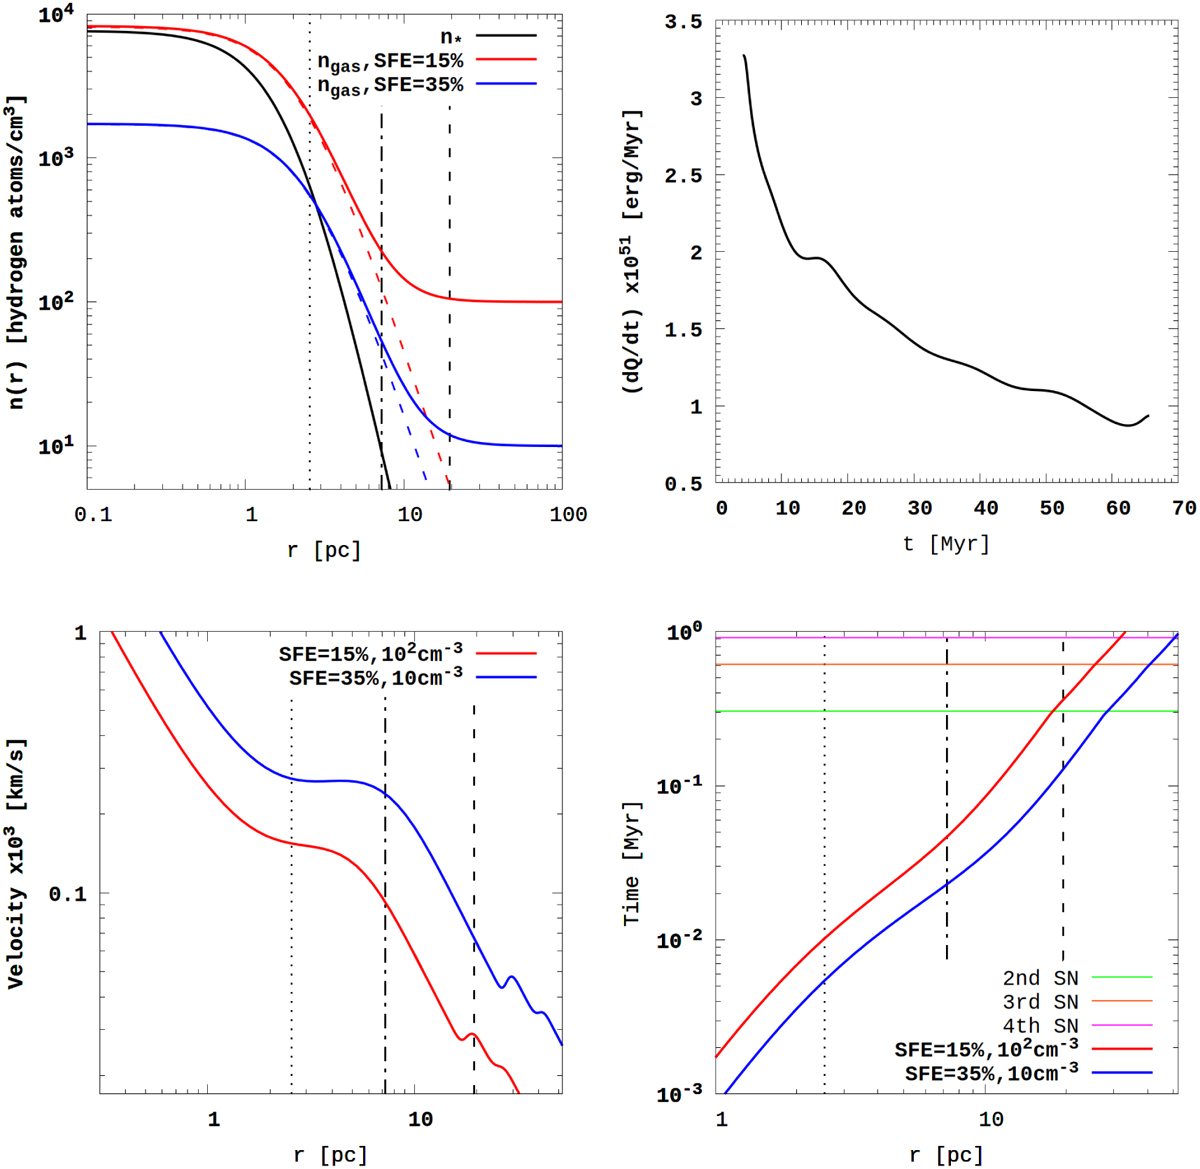
Characteristic profiles of gas expulsion processes inside the star cluster (from left to right, top to bottom). Calculated concentration profiles of the cluster stellar n★ and gaseous nɡas material for the two cases: SFE = 0.15 with ncload = 100 cm−3 and SFE = 0.35 with ncload = 10 cm−3. The supernova explosion energy rate inside the cluster as a function of time is shown. The shockwave velocity and the shockwave travel time from the centre of the cluster as a function of the front radius. The dotted and dashed-dotted black vertical lines represent the radii within which 50% and 90% of the cluster stellar mass are enclosed, respectively. The dashed black vertical line represents the simulated cluster boundary, rcluster, which we assume to be equal to 20 ap (for the example model, it is ~19.5 pc).
Current usage metrics show cumulative count of Article Views (full-text article views including HTML views, PDF and ePub downloads, according to the available data) and Abstracts Views on Vision4Press platform.
Data correspond to usage on the plateform after 2015. The current usage metrics is available 48-96 hours after online publication and is updated daily on week days.
Initial download of the metrics may take a while.