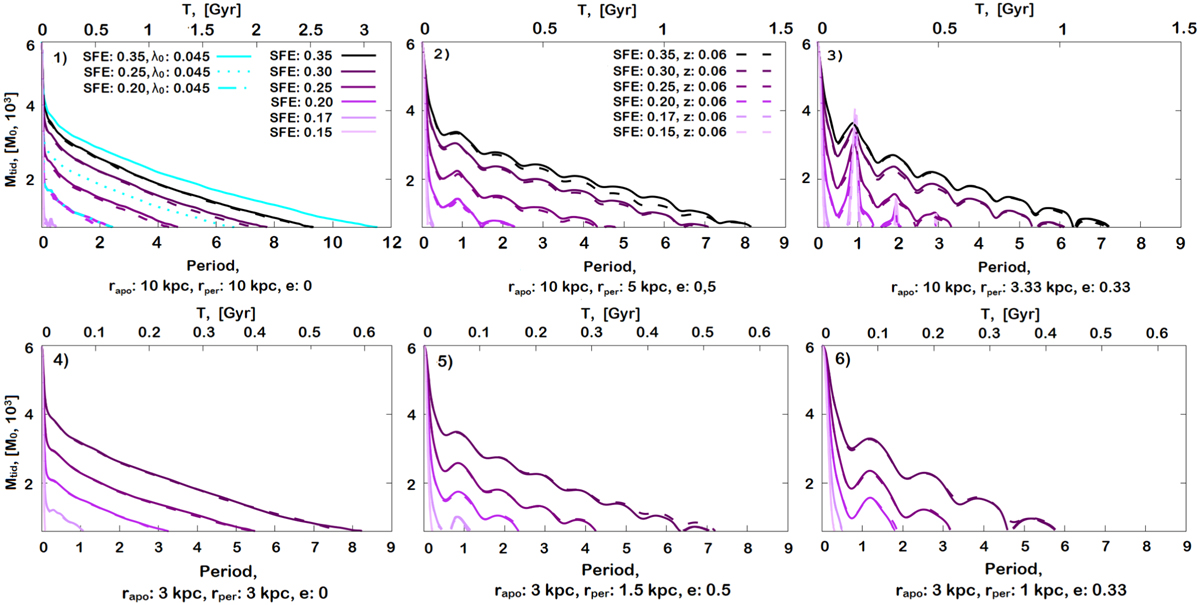
Fig. 4
Download original image
Evolution of mass loss in OCs for different SFEs with λ0 = 0.09 (solid lines). Models with rapo = 10 kpc and e = 0, 0.33, and 0.5 are shown in the upper panels. Models with rapo = 3 kpc are shown in the bottom panels. Dashed lines represent orbits with initial Z values of 0.2 kpc upper panels) and 0.06 kpc (bottom panels) above the Galactic X − Y plane. Cyan lines represent models with λ0 = 0.045 for OCs with rapo = 10 kpc.
Current usage metrics show cumulative count of Article Views (full-text article views including HTML views, PDF and ePub downloads, according to the available data) and Abstracts Views on Vision4Press platform.
Data correspond to usage on the plateform after 2015. The current usage metrics is available 48-96 hours after online publication and is updated daily on week days.
Initial download of the metrics may take a while.