Fig. 2
Download original image
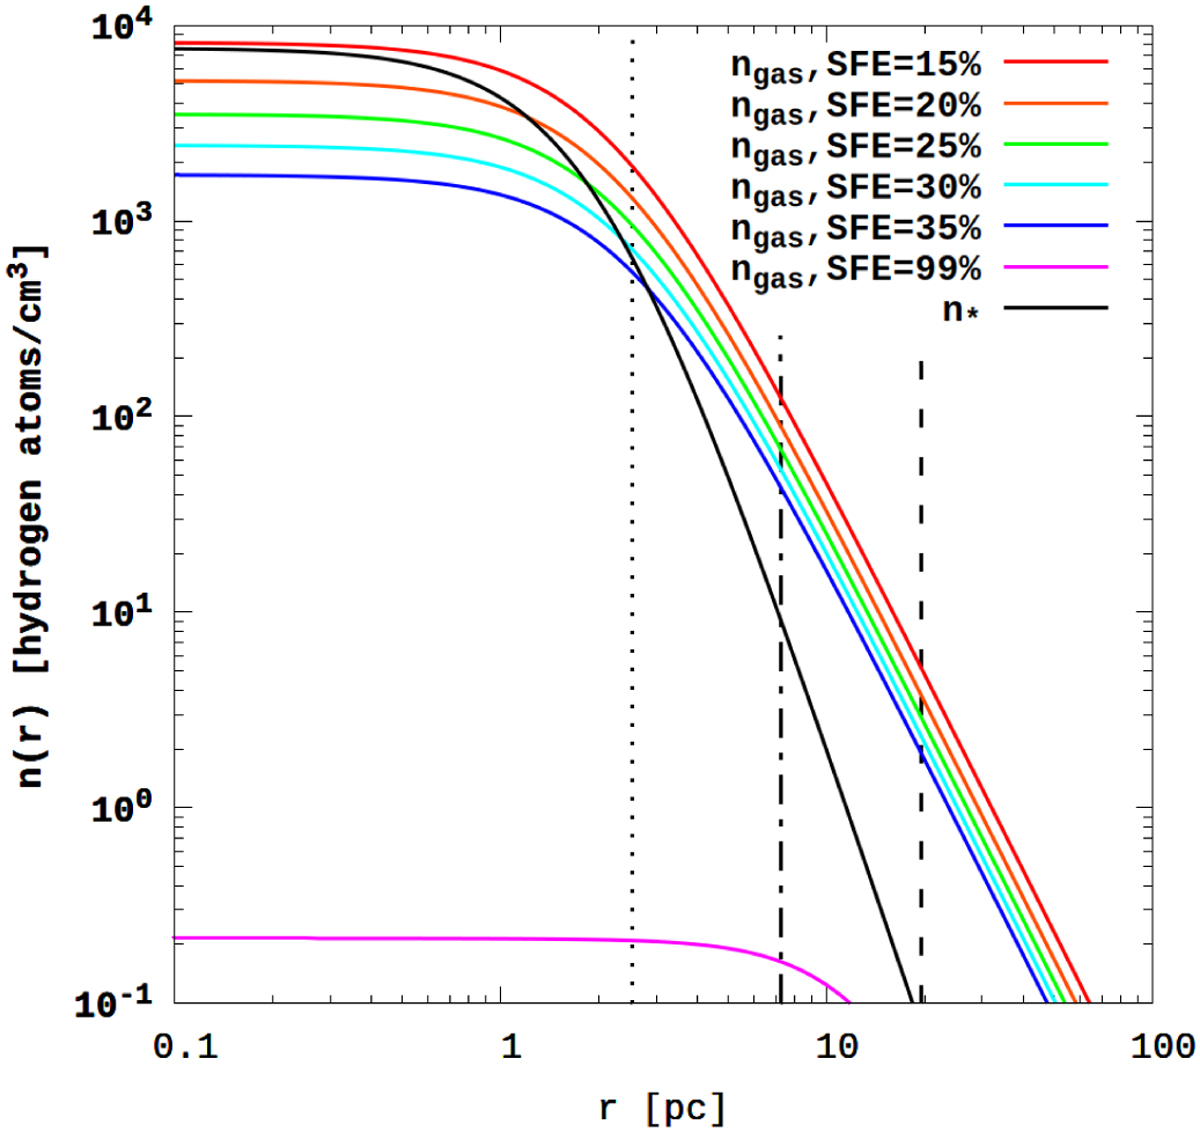
Concentration profiles of cluster’s stellar (n⋆) and gaseous (n𝑔as) material are shown for different SFEs, ranging from 0.15 to 0.35 and 0.99. The dotted and dash-dotted black vertical lines represent the radii enclosing 50% and 90% of the cluster’s stellar mass, respectively. The dashed black vertical line marks the simulated cluster boundary, rcluster, which is defined as 20 ⋅ ap. For the rapo = 10 kpc and λ0 = 0.09 models (see Sect. 2.4), this corresponds to ~19.5 pc.
Current usage metrics show cumulative count of Article Views (full-text article views including HTML views, PDF and ePub downloads, according to the available data) and Abstracts Views on Vision4Press platform.
Data correspond to usage on the plateform after 2015. The current usage metrics is available 48-96 hours after online publication and is updated daily on week days.
Initial download of the metrics may take a while.