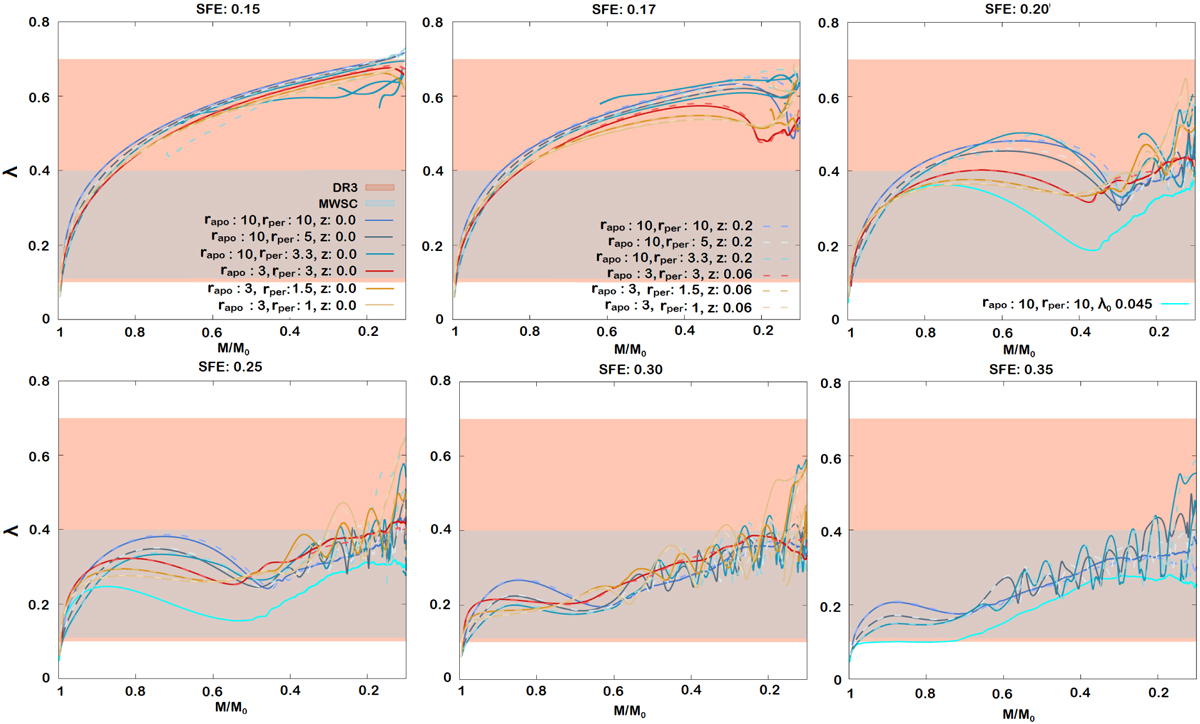
Fig. 11
Download original image
Evolution of half-mass Roche-volume filling factor λ as a function of the bound mass M/M⊙ for SFE = 0.15, 0.17, 0.20, 0.25,0.30, and 0.35 with λ0 = 0.09. The blue coloured palette curves represent rapo = 10 kpc with e = 0, 0.5, and 0.33; while the red coloured palette curves represent the same, but for rapo = 3 kpc. Solid curves represent the data for Z = 0, and dashed curves represent Z = 0.2 kpc for rapo = 10 kpc and Z = 0.06 kpc for rapo = 3 kpc. The cyan curves represent data for λ0 = 0.045 for rapo = 10 and e = 0. The distribution of the observational OC data from Gaia DR3 is shown in light red, and that from MWSC is shown in light blue.
Current usage metrics show cumulative count of Article Views (full-text article views including HTML views, PDF and ePub downloads, according to the available data) and Abstracts Views on Vision4Press platform.
Data correspond to usage on the plateform after 2015. The current usage metrics is available 48-96 hours after online publication and is updated daily on week days.
Initial download of the metrics may take a while.