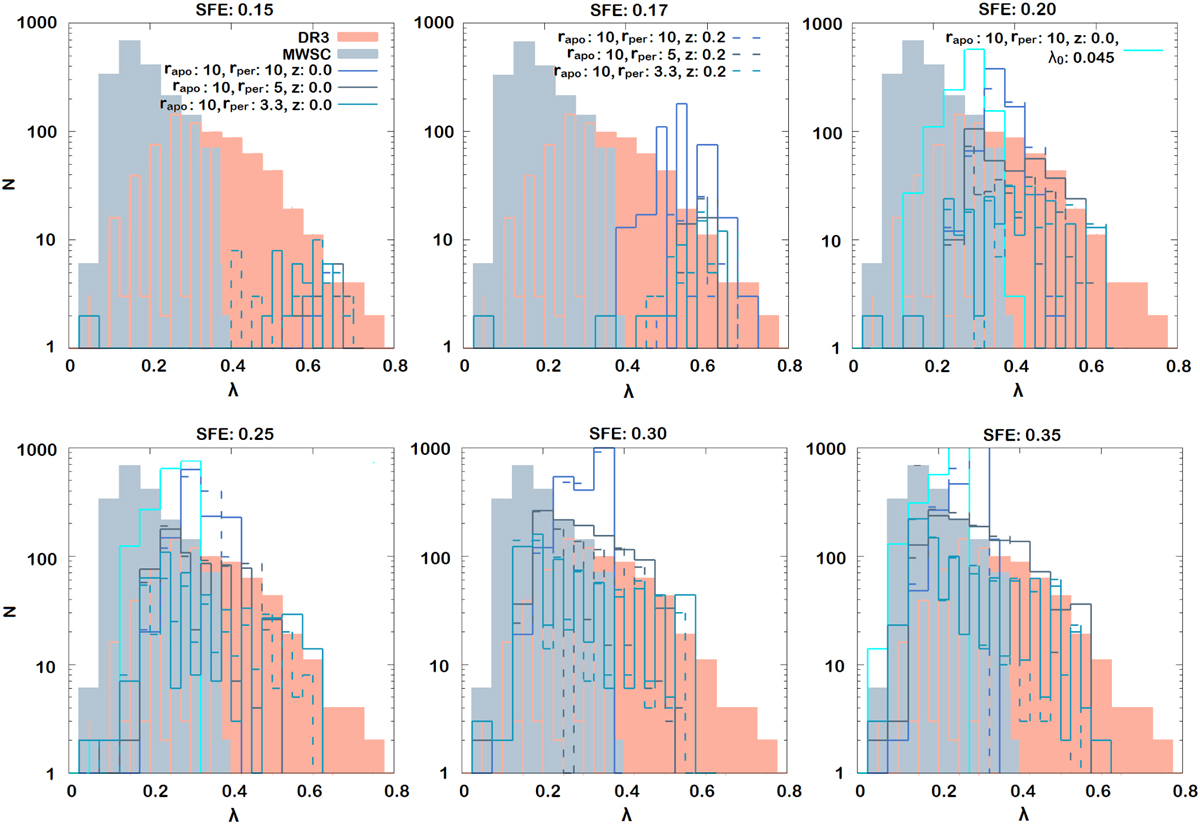
Fig. 10
Download original image
Number of clusters (inside the catalogue’s completeness limits around the Sun) as a function of the observed cluster’s Roche-volume filling factor − λ. The distribution of the observational OC data from Gaia DR3 is shown in light red, and the MWSC catalogue is shown in light blue. The different panels show the theoretical distributions for different SFE models (with rapo = 10 kpc). The lines with different colours show models with different orbital eccentricities. The dotted lines present the results for the non-planar orbits (Z0 = 200 pc). The cyan lines show the results for the three special models with the half-reduced initial λ0 = 0.045.
Current usage metrics show cumulative count of Article Views (full-text article views including HTML views, PDF and ePub downloads, according to the available data) and Abstracts Views on Vision4Press platform.
Data correspond to usage on the plateform after 2015. The current usage metrics is available 48-96 hours after online publication and is updated daily on week days.
Initial download of the metrics may take a while.