Fig. 5
Download original image
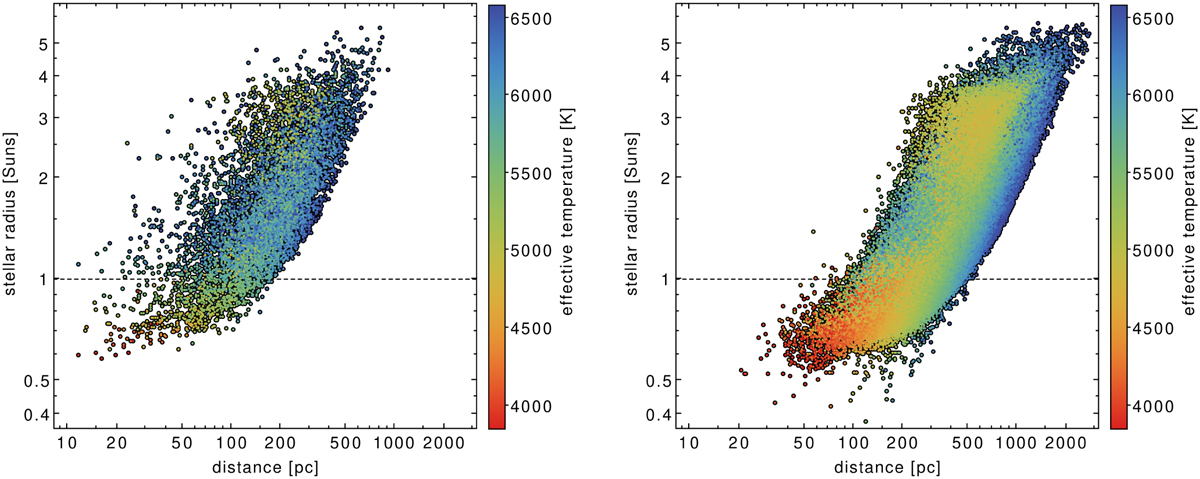
Distance of the P1/P2 and P5 samples in LOPS2. Left panel: distribution of the 8235 P1+P2 stars in LOPS2 in the (R⋆, distance) plane. The stellar effective temperature from the PIC v2.0.0 is color coded. Right panel: same but for the P5 sample (167 149 stars; P1/P2 not included). The distribution moves to larger distances due to the fainter magnitude limit of P5 (V < 13 vs. V < 11).
Current usage metrics show cumulative count of Article Views (full-text article views including HTML views, PDF and ePub downloads, according to the available data) and Abstracts Views on Vision4Press platform.
Data correspond to usage on the plateform after 2015. The current usage metrics is available 48-96 hours after online publication and is updated daily on week days.
Initial download of the metrics may take a while.