Fig. 8.
Download original image
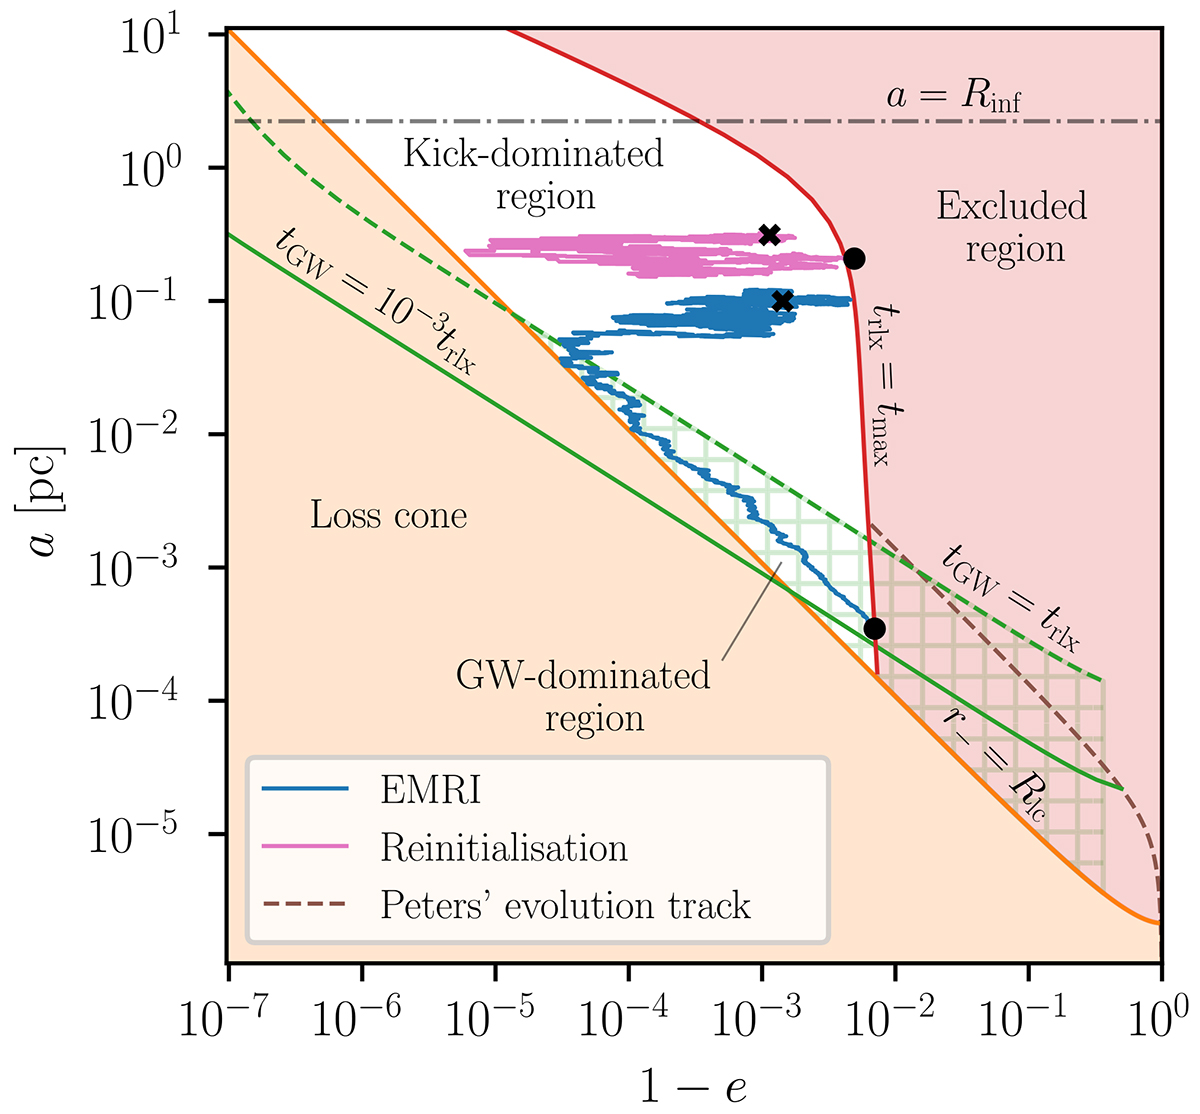
Two examples of orbit evolution in the (1 − e, a) plane. The blue line shows the formation of an EMRI that is missed by our standard definition, and requires the correction described in the text to be rightfully counted. The pink line instead shows a regular reinitialisation. We also plot the evolution line of an orbit that passes through the minimum of the tGW = 10−3trlx curve following Eq. (32) (dashed brown line). It can be seen that all orbits that cross into the excluded region while being in the GW-dominated region fall below this evolution line, meaning they will reach the solid green curve, as long as the stochastic kicks due to two-body relaxation are small (see Fig. 1 for the meaning of the other elements). Here we set M• = 4 × 10⁶ M⊙.
Current usage metrics show cumulative count of Article Views (full-text article views including HTML views, PDF and ePub downloads, according to the available data) and Abstracts Views on Vision4Press platform.
Data correspond to usage on the plateform after 2015. The current usage metrics is available 48-96 hours after online publication and is updated daily on week days.
Initial download of the metrics may take a while.