Fig. 5.
Download original image
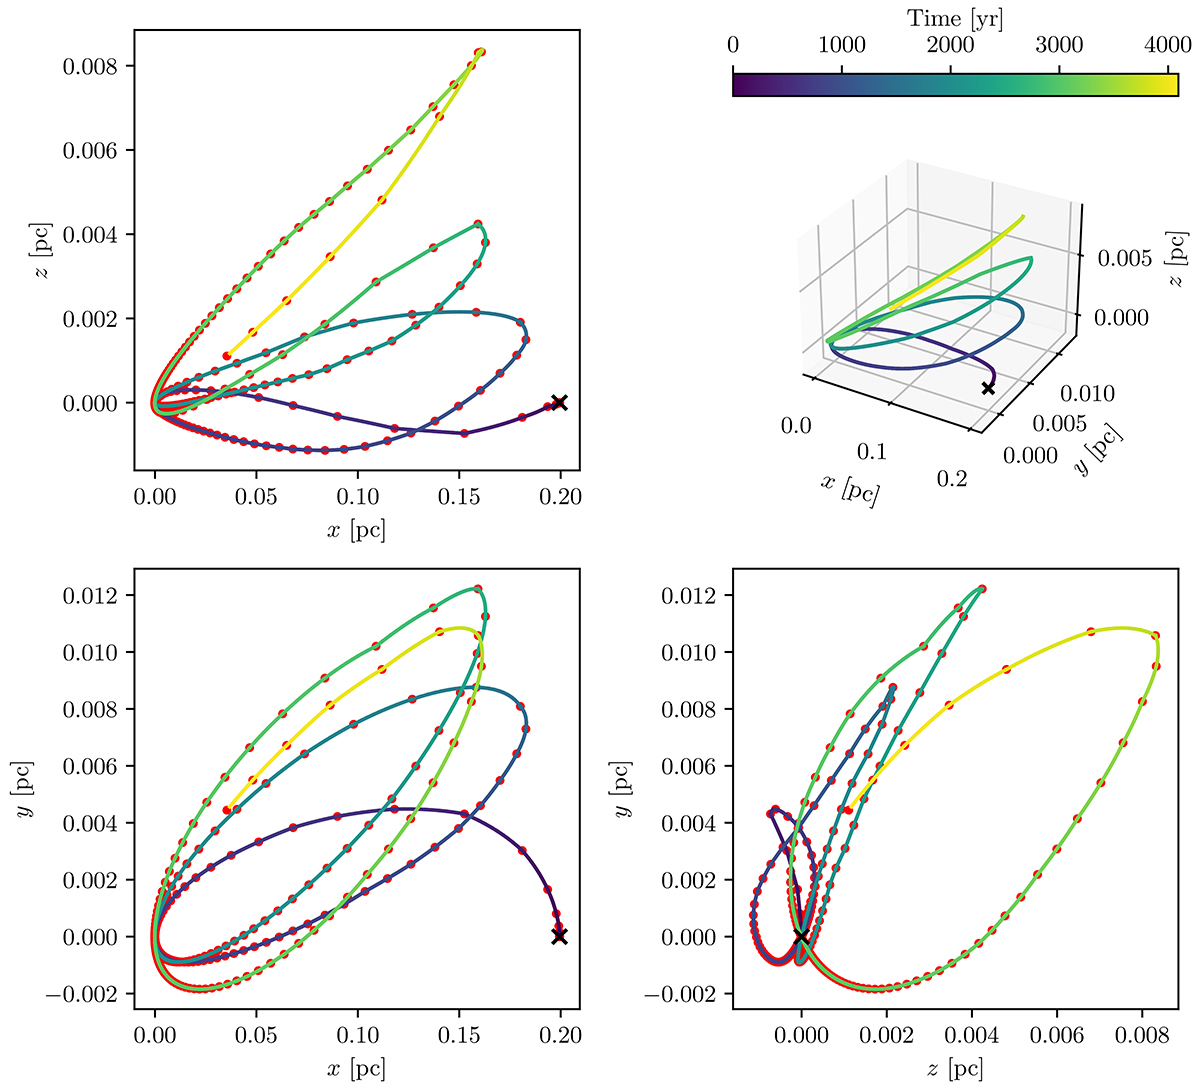
Evolution of the position of a stellar-mass BH over few passages of the apocentre, using our local treatment of two-body relaxation. The top right panel shows the 3D trajectory of the stellar-mass BH, while the other three panels show its projections onto the three planes of the reference system. The colour of the curve shows the time elapsed since the beginning of the evolution. The red dots indicate the points where a velocity kick is given and they coincide with the time step of the main integrator. The points between the red dots are interpolated. The black cross shows the initial position of the stellar-mass BH, while the MBH is fixed at (0, 0, 0). We note that the y- and z-axes have different scales for better readability. In this example M• = 4 × 10⁶ M⊙, a0 = 0.1 pc, e0 = 0.999.
Current usage metrics show cumulative count of Article Views (full-text article views including HTML views, PDF and ePub downloads, according to the available data) and Abstracts Views on Vision4Press platform.
Data correspond to usage on the plateform after 2015. The current usage metrics is available 48-96 hours after online publication and is updated daily on week days.
Initial download of the metrics may take a while.