Fig. 3.
Download original image
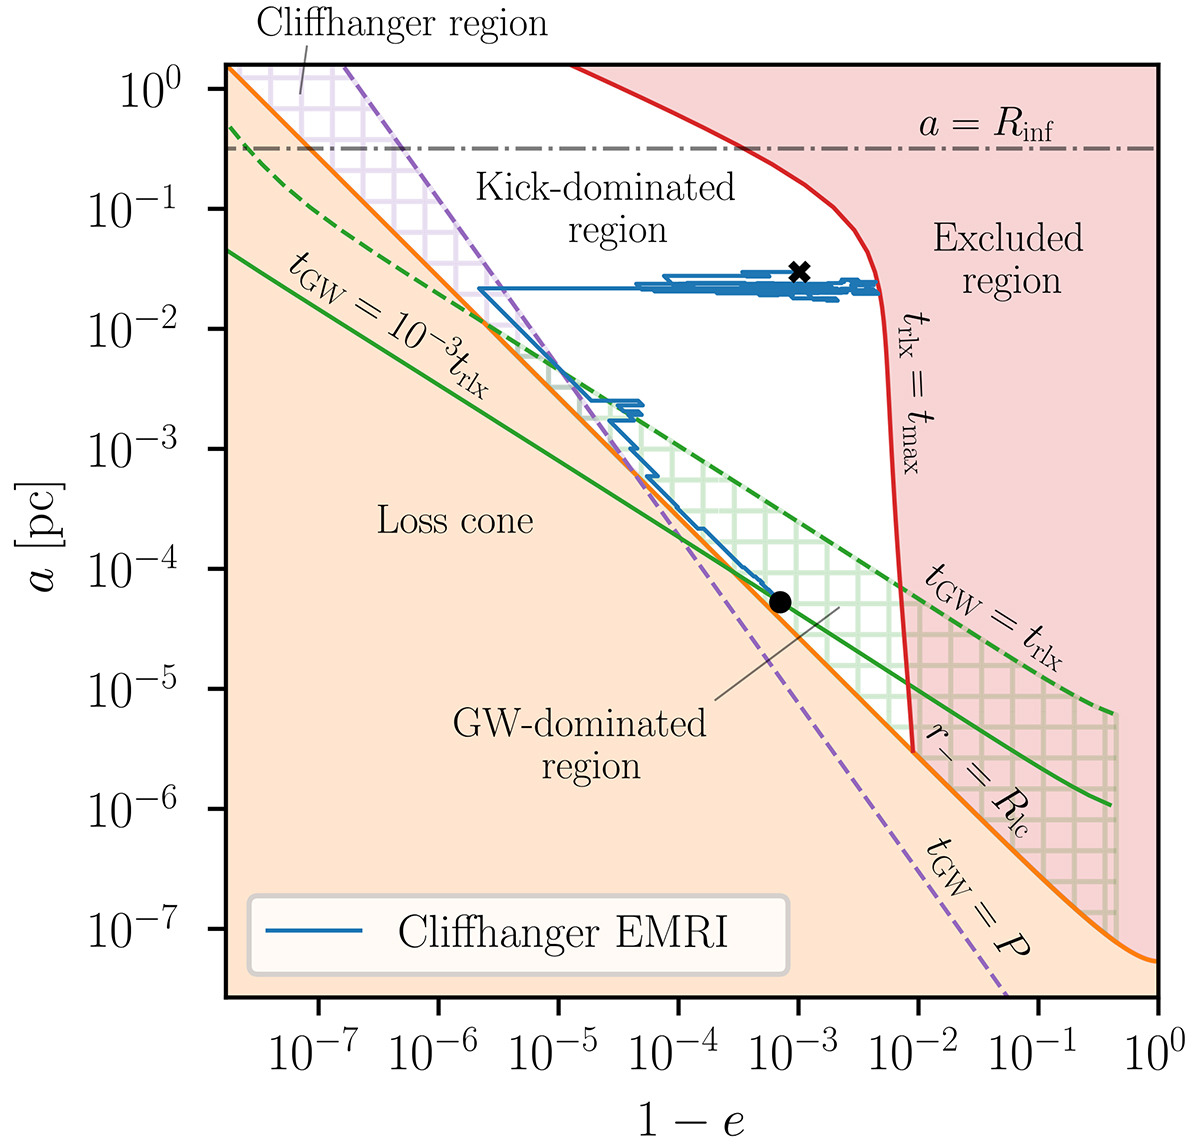
Example of a cliffhanger EMRI orbit in the (1 − e, a) plane. The cliffhanger region is filled with a purple grid, and it is delimited by the purple dashed line and the orange solid curve (see Fig. 1 for the meaning of the other elements). The sharp tightening of the orbit at the passage inside the cliffhanger region occurs during a single pericentre passage. Here we set M• = 105 M⊙.
Current usage metrics show cumulative count of Article Views (full-text article views including HTML views, PDF and ePub downloads, according to the available data) and Abstracts Views on Vision4Press platform.
Data correspond to usage on the plateform after 2015. The current usage metrics is available 48-96 hours after online publication and is updated daily on week days.
Initial download of the metrics may take a while.