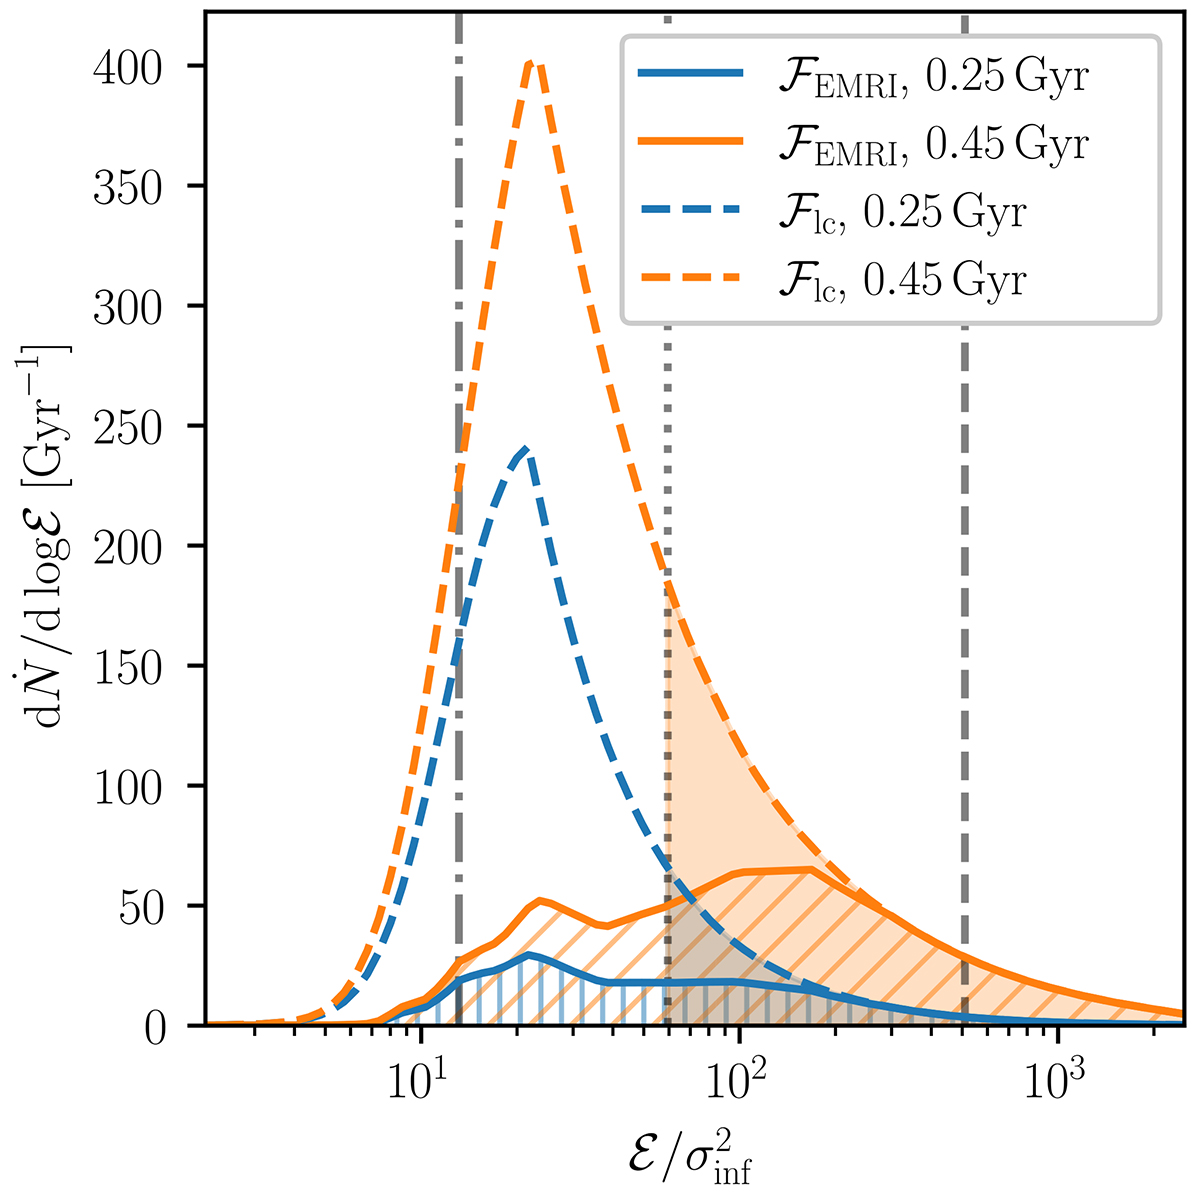
Fig. 14.
Download original image
Differential rate of EMRIs ℱEMRI (solid lines) and of EMRIs and DPs ℱlc (dashed lines) as functions of energy. Quantities refer to a nuclear cluster with M• = 3 × 10⁵ M⊙ that has relaxed for 25 Myr (blue lines) and 45 Myr (orange lines). We report for reference vertical lines at the values of ℰ such that rc(ℰ) is 0.1 Rinf (dash-dotted), 0.01 Rinf (dotted) and 0.001 Rinf (dashed). The colour-filled area of ℱlc gives the classical EMRI rate at rc(ℰ) > 0.01 Rinf, to be compared with the hatched area of ℱEMRI over the full energy range. Apparent areas in the plot are proportional to the various integrals of the form ∫dℰ ℱ.
Current usage metrics show cumulative count of Article Views (full-text article views including HTML views, PDF and ePub downloads, according to the available data) and Abstracts Views on Vision4Press platform.
Data correspond to usage on the plateform after 2015. The current usage metrics is available 48-96 hours after online publication and is updated daily on week days.
Initial download of the metrics may take a while.