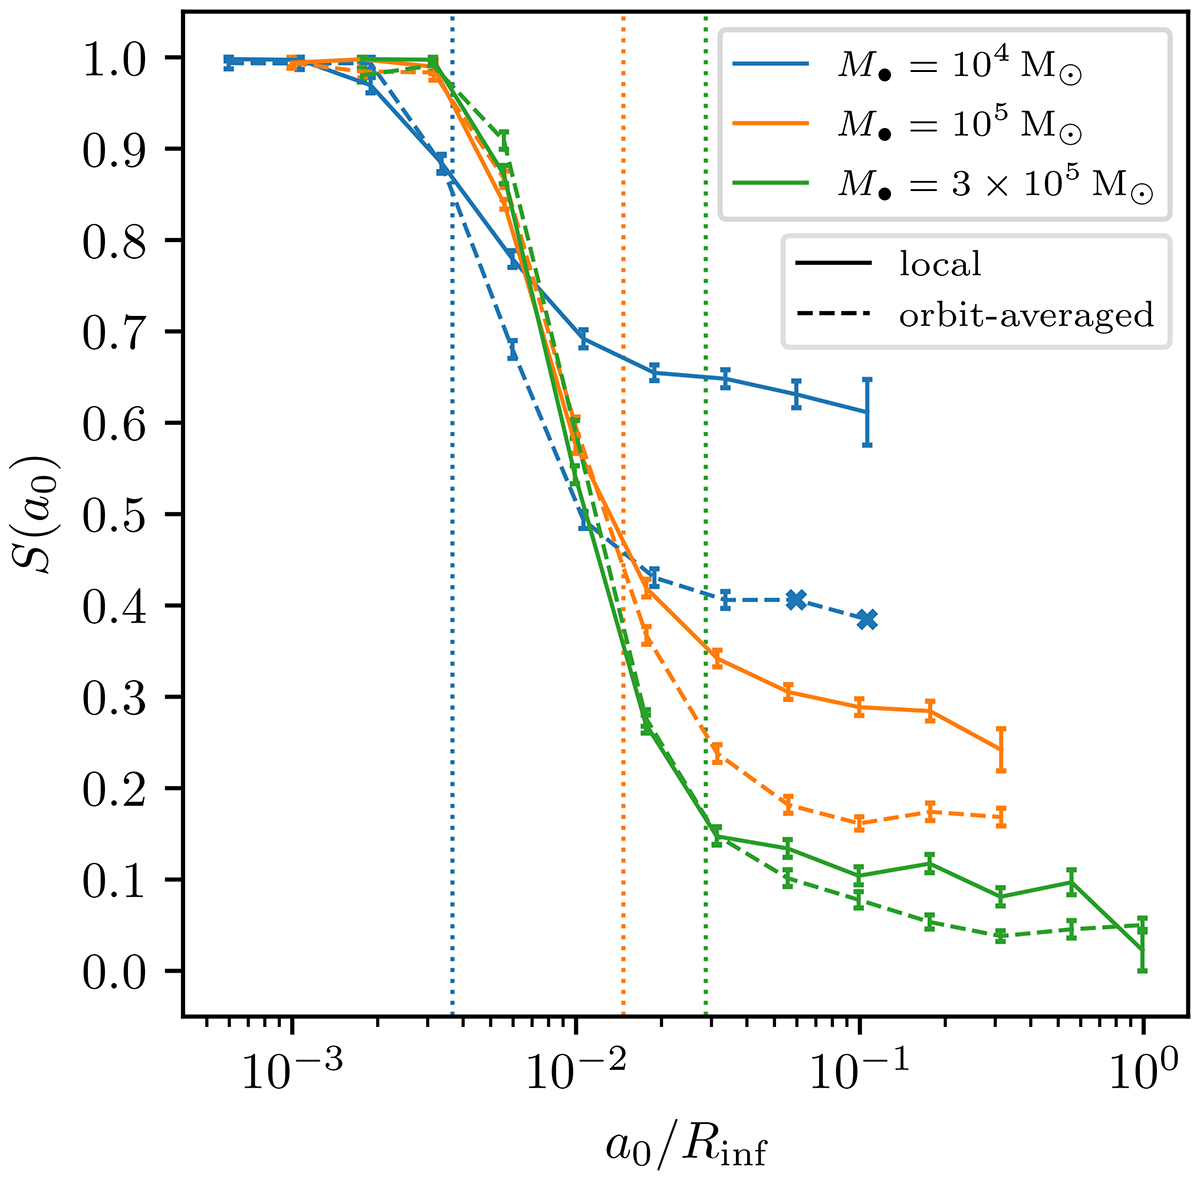
Fig. 12.
Download original image
Comparison of the S(a0) function obtained by employing the local (solid lines) vs orbit-averaged (dashed lines) treatment of two-body relaxation. The vertical dotted lines mark, for each case, the value of a0/Rinf at which q = 1, thus marking the transition from the empty (at smaller a0) to the full loss cone regime. The crosses indicate the points for which the orbit-averaged procedure explained in Sect. 3.3 failed many times.
Current usage metrics show cumulative count of Article Views (full-text article views including HTML views, PDF and ePub downloads, according to the available data) and Abstracts Views on Vision4Press platform.
Data correspond to usage on the plateform after 2015. The current usage metrics is available 48-96 hours after online publication and is updated daily on week days.
Initial download of the metrics may take a while.