Fig. 10.
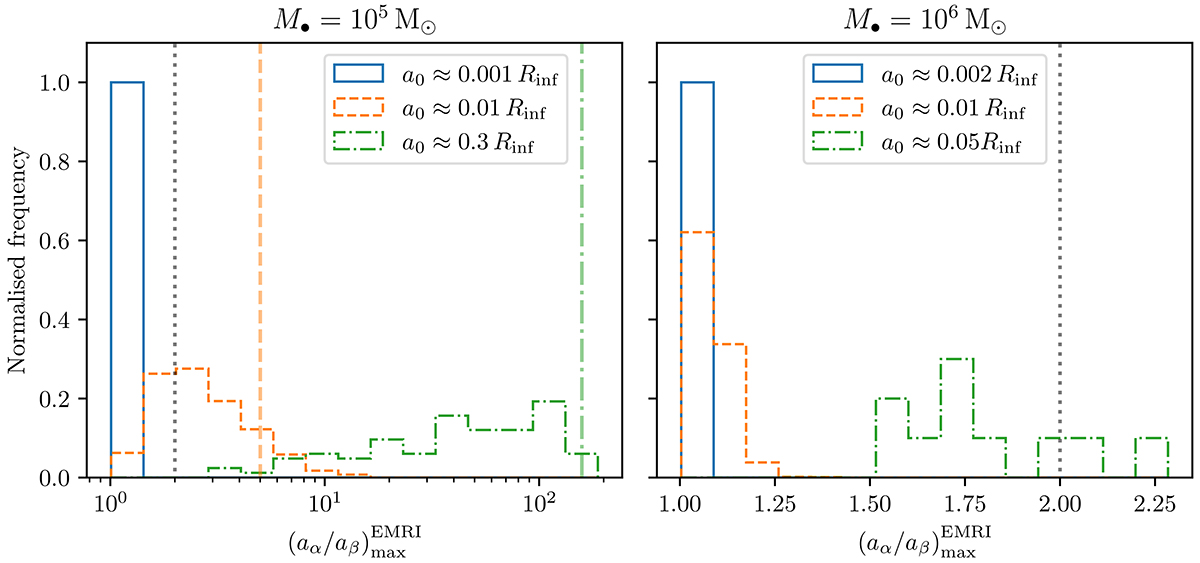
Download original image
Distribution of the maximum ratio between a evaluated at subsequent apocentres for EMRIs for selected values of M• and a0. The black dotted vertical line shows (aα/aβ)maxEMRI = 2, which roughly delimits cliffhanger EMRIs to its right. In the left panel, the orange dashed and green dash-dotted vertical lines show a0/aflc from Eq. (38), which is a rough prediction of the highest possible (aα/aβ)maxEMRI ratio. Each histogram is normalised to 1. We note the different x-axis scales and binning strategies in the two panels.
Current usage metrics show cumulative count of Article Views (full-text article views including HTML views, PDF and ePub downloads, according to the available data) and Abstracts Views on Vision4Press platform.
Data correspond to usage on the plateform after 2015. The current usage metrics is available 48-96 hours after online publication and is updated daily on week days.
Initial download of the metrics may take a while.