Fig. 1.
Download original image
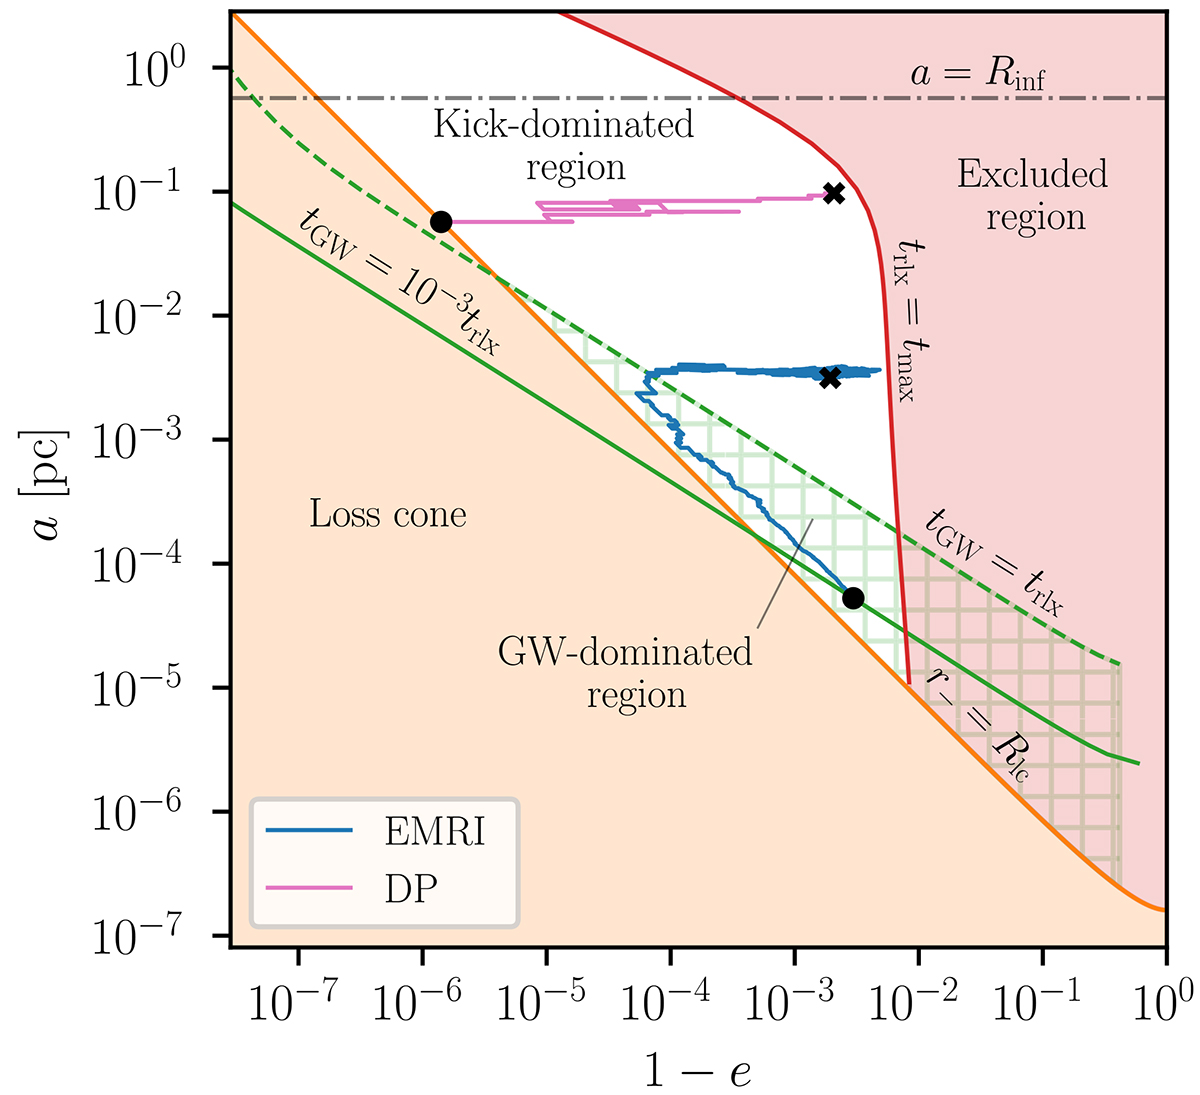
Two examples of orbit evolution in the (1 − e, a) plane. The blue line shows the formation of an EMRI, while the pink one results in a DP. Both are mainly randomised in eccentricity while inside the white kick-dominated region. When the blue line crosses into the GW-dominated region, which is filled with a green grid, it predominantly evolves via GW emission. DPs are identified by the crossing of the loss cone edge, which is represented by the solid orange curve. EMRIs instead must reach the portion of the solid green curve in between the loss cone and the excluded region (see Sect. 3.4). Here we set M• = 3 × 10⁵ M⊙.
Current usage metrics show cumulative count of Article Views (full-text article views including HTML views, PDF and ePub downloads, according to the available data) and Abstracts Views on Vision4Press platform.
Data correspond to usage on the plateform after 2015. The current usage metrics is available 48-96 hours after online publication and is updated daily on week days.
Initial download of the metrics may take a while.