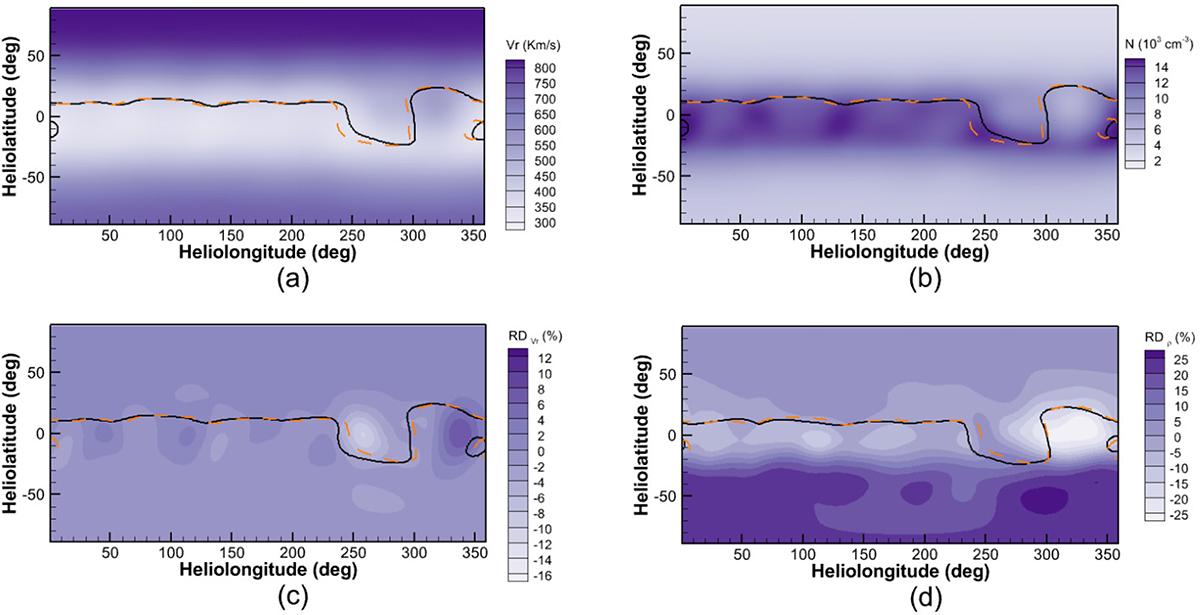
Fig. 5.
Download original image
Distribution of the radial plasma speeds, Vr, in units of km s−1 (a) and proton number density in units of 103 cm−3 (b) at 20 Rs derived from the 82nd hour of the time-evolving coronal simulation. Panels c and d show the relative differences in radial velocity and plasma density between the quasi-steady-state and time-evolving coronal simulations. Online movies 3 and 4 illustrate the evolution of these relative differences. The solid black lines and the dashed orange lines represent the MNLs calculated by the time-evolving and quasi-steady-state coronal models.
Current usage metrics show cumulative count of Article Views (full-text article views including HTML views, PDF and ePub downloads, according to the available data) and Abstracts Views on Vision4Press platform.
Data correspond to usage on the plateform after 2015. The current usage metrics is available 48-96 hours after online publication and is updated daily on week days.
Initial download of the metrics may take a while.