Fig. 1.
Download original image
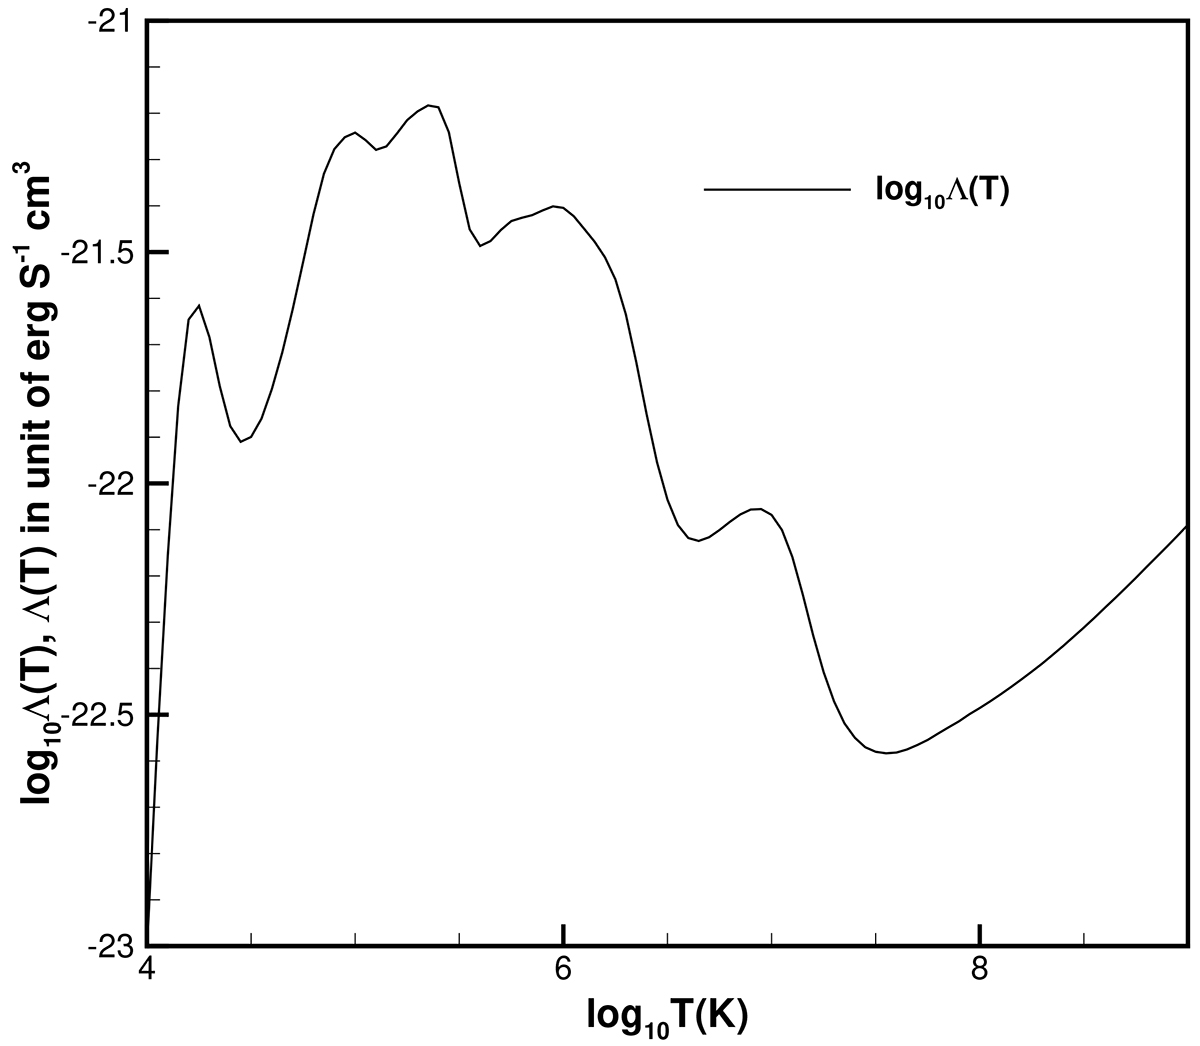
Radiative cooling curve profile derived from version 9 of the CHIANTI atomic database (Dere et al. 2019). The horizontal axis denotes the decadic logarithm of temperature, and the vertical axis the logarithm of the radiative cooling curve function value. The temperature and radiative cooling curve function units are K and erg s−1 cm3, respectively.
Current usage metrics show cumulative count of Article Views (full-text article views including HTML views, PDF and ePub downloads, according to the available data) and Abstracts Views on Vision4Press platform.
Data correspond to usage on the plateform after 2015. The current usage metrics is available 48-96 hours after online publication and is updated daily on week days.
Initial download of the metrics may take a while.