Fig. 7
Download original image
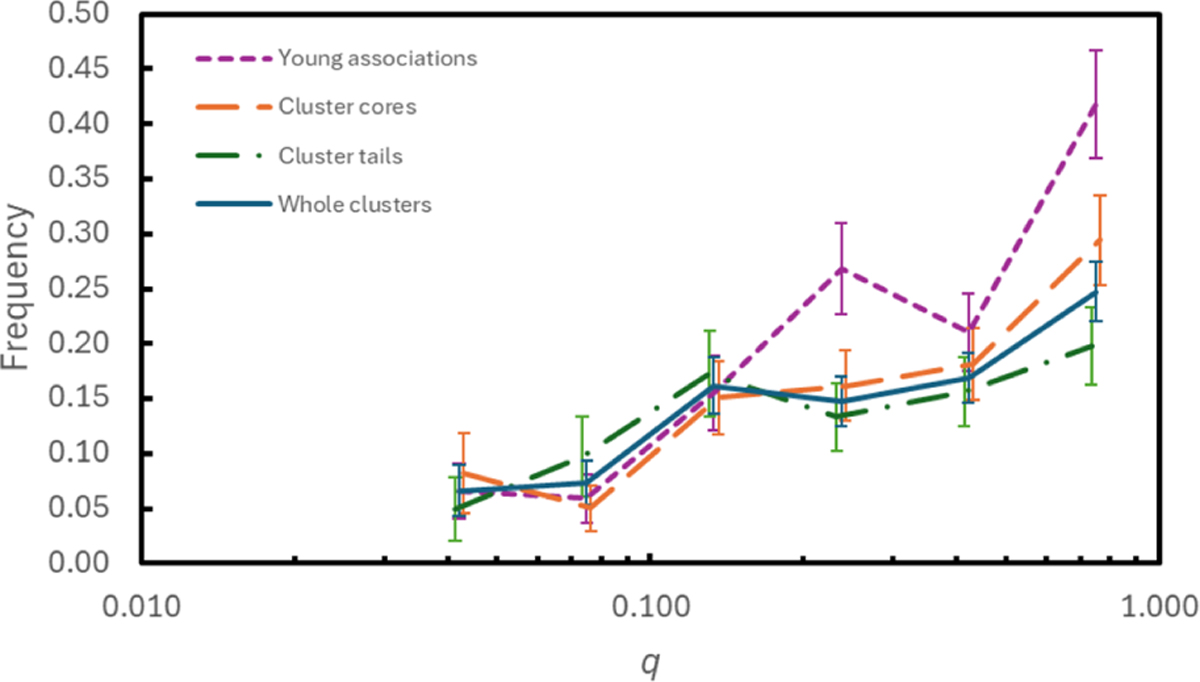
Mass ratio q distribution of the frequency of companions. The observed frequencies were corrected for incompleteness using the results obtained in Section 6 (averaged over semi-major axis 0.01 < a < 10 000 au). Blue solid line is for combination of all clusters; orange long dashed line is for the cluster cores, green dot-dashed line is for cluster tails, and the violet short-dashed line is for NYMGs (Gratton et al. 2024). Some of the distributions have been slightly shifted horizontally to allow the appropriate error bars to be distinguished.
Current usage metrics show cumulative count of Article Views (full-text article views including HTML views, PDF and ePub downloads, according to the available data) and Abstracts Views on Vision4Press platform.
Data correspond to usage on the plateform after 2015. The current usage metrics is available 48-96 hours after online publication and is updated daily on week days.
Initial download of the metrics may take a while.