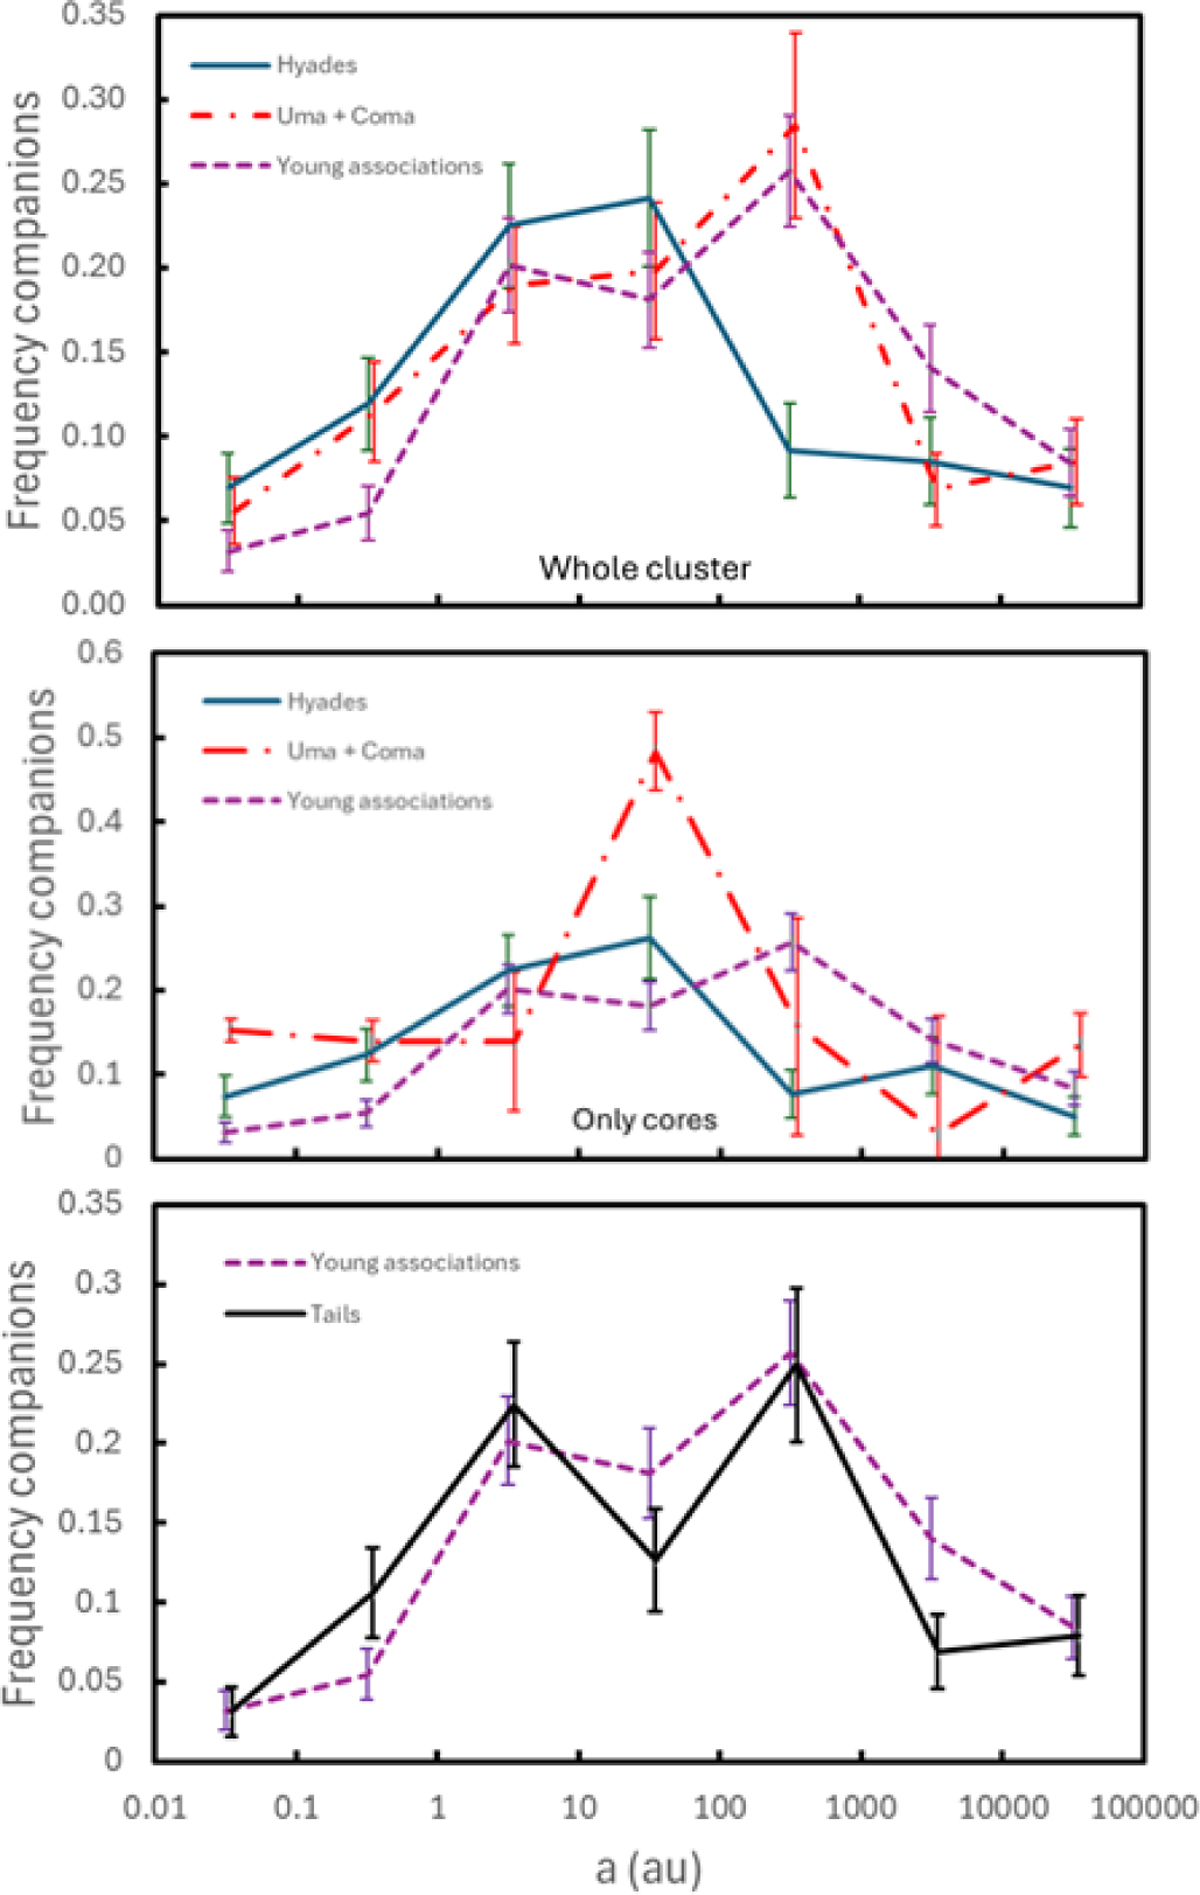
Fig. 6
Download original image
Frequency of companions with semi-major axis a in one-decade bins. The observed frequencies were corrected for incompleteness using the results obtained in Section 6 (averaged over mass ratios q > 0.05). Upper panel is for the whole samples considered in this paper; middle panel is only for the cores of the different stellar systems; lower panel is for the tails of of the clusters. Blue solid line is for Hyades, red dash- dotted line is for the sum of Ursa Major and Coma Berenices, black solid line is the average of the tails of the clusters, violet short-dashed line is for NYMGs (Gratton et al. 2024). Some of the distributions have been slightly shifted horizontally to allow the appropriate error bars to be distinguished.
Current usage metrics show cumulative count of Article Views (full-text article views including HTML views, PDF and ePub downloads, according to the available data) and Abstracts Views on Vision4Press platform.
Data correspond to usage on the plateform after 2015. The current usage metrics is available 48-96 hours after online publication and is updated daily on week days.
Initial download of the metrics may take a while.