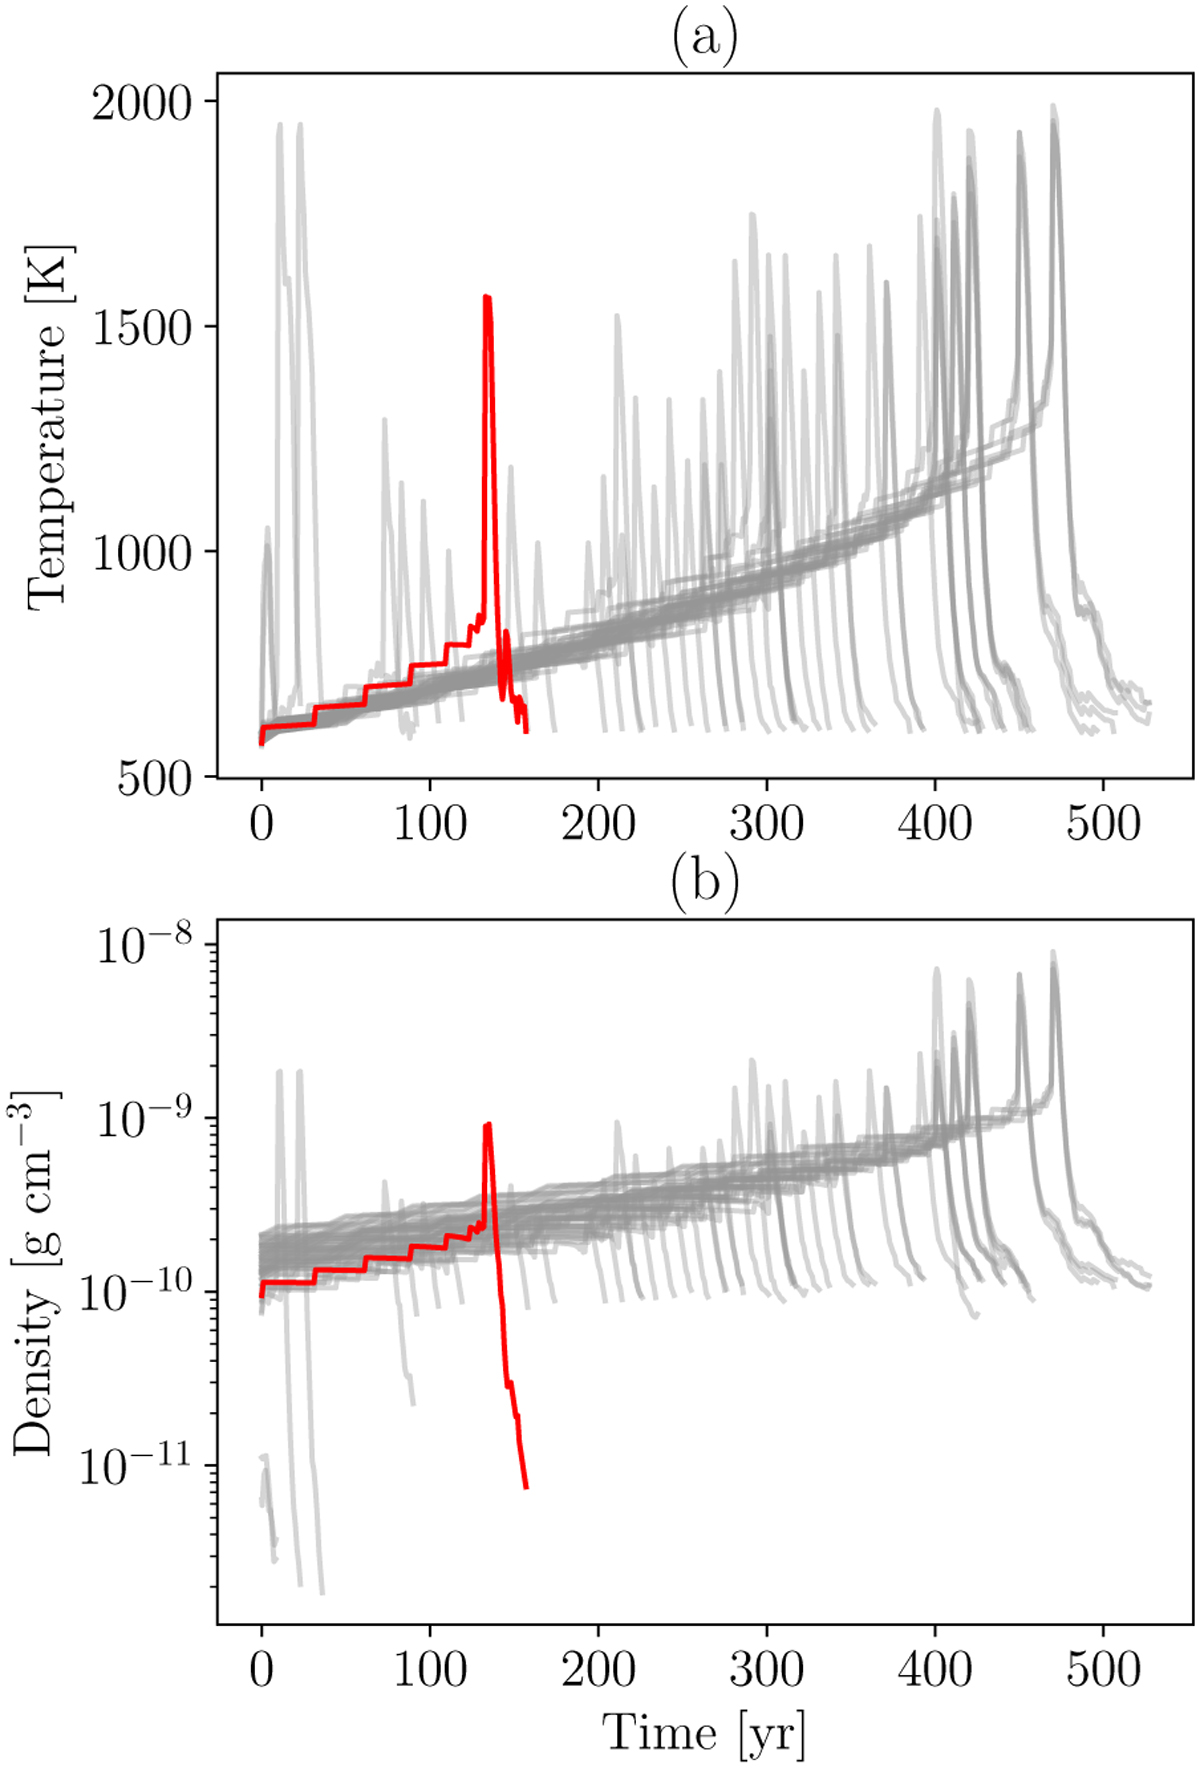
Fig. 8
Download original image
Evolutions of the temperature in panel a and the density in panel b of the gas surrounding one-micron grains in the collapse simulation of Bhandare et al. (2024). The 55 trajectories selected from the simulation are those where the grains experience a maximum temperature between 1000 and 2000 K. Each trajectory starts at a temperature of 600 K. The red solid line represents the trajectory chosen in this article to compute the dust evolution. The grain position evolution is shown in Fig. 9.
Current usage metrics show cumulative count of Article Views (full-text article views including HTML views, PDF and ePub downloads, according to the available data) and Abstracts Views on Vision4Press platform.
Data correspond to usage on the plateform after 2015. The current usage metrics is available 48-96 hours after online publication and is updated daily on week days.
Initial download of the metrics may take a while.