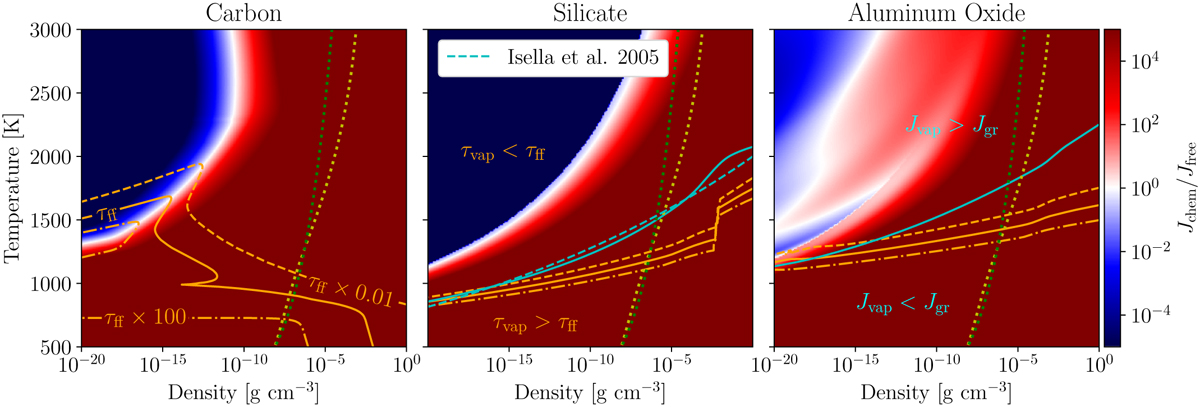
Fig. 4
Download original image
Color map showing the ratio between the chemisputtering vaporization and the free vaporization flux as a function of temperature and density of the gas, with a saturation at 10−5 and 105. Red corresponds to the area where the chemisputtering vaporization flux dominates, and blue corresponds to the area where the free vaporization flux dominates. The yellow dotted line represents the barotropic law (see Eq. (30)), and the green dotted line represents a typical disk model from Andrews et al. (2009, see our Sect. 5.2 and Eqs. (41) and (42)). The cyan solid line represents the limit where the vaporization flux is equal to the growth flux. The vaporization dominates for higher temperatures (above the line) and the growth dominates for lower temperatures (below the line). The carbon grains do not have this line as vaporization always dominates for the range of temperatures and density of this plot. The cyan dashed line represents the sublimation limit prescription of the silicates used in Isella & Natta (2005). Its expression is given in Eq. (31). Finally, the orange solid line represents the limit where the vaporization timescale is equal to the free-fall timescale. For higher temperatures (above the line), the vaporization timescale is smaller than the free-fall timescale, and for lower temperatures (below the line), the vaporization timescale is larger than the free-fall timescale. The two other orange lines represent the limit where the vaporization timescale is equal to the free-fall timescale, but multiplied by a factor of 100 (dot-dashed) and 0.01 (dashed). The jump in the orange lines on the middle panel is due to a change in the key reactant in reaction (23), being Mg for lower densities and SiO for higher densities. The vaporization timescales are computed with a grain radius of 5 × 10⁻⁷ cm in Eq. (28).
Current usage metrics show cumulative count of Article Views (full-text article views including HTML views, PDF and ePub downloads, according to the available data) and Abstracts Views on Vision4Press platform.
Data correspond to usage on the plateform after 2015. The current usage metrics is available 48-96 hours after online publication and is updated daily on week days.
Initial download of the metrics may take a while.