Fig. 9.
Download original image
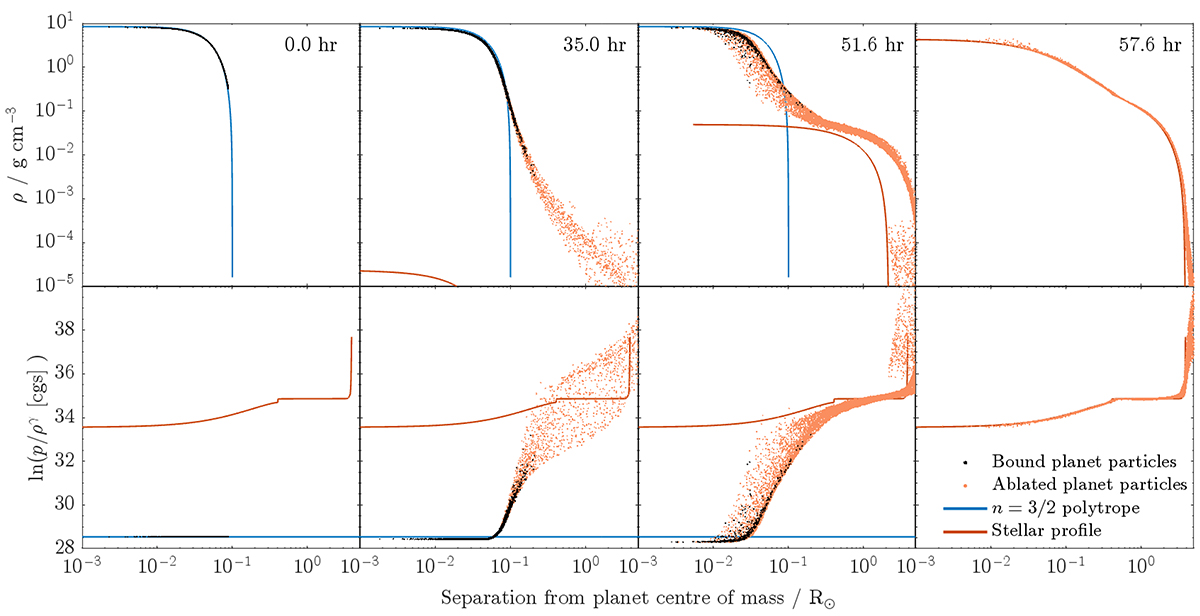
HJ’s radial structure at four different points in the simulation, with the first three columns corresponding to panels a), b), and d) in Figure 4, while the rightmost column occurs shortly after planet disruption. Top panels: Density profile. Bottom panels: Entropy, defined as ln(p/ργ) where p and ρ are pressure and density in cgs units, and γ = 5/3 is the adiabatic exponent. Bound planet SPH particles are plotted as black dots, while ablated planetary material is shown as orange dots. The n = 3/2 polytrope used for modelling the HJ is in blue. The red line shows a shifted stellar profile, plotted from the planet’s current centre of mass to show the local conditions encountered by the planetary material. In the rightmost column, the origin is taken to be the stellar centre since the HJ has completely disrupted.
Current usage metrics show cumulative count of Article Views (full-text article views including HTML views, PDF and ePub downloads, according to the available data) and Abstracts Views on Vision4Press platform.
Data correspond to usage on the plateform after 2015. The current usage metrics is available 48-96 hours after online publication and is updated daily on week days.
Initial download of the metrics may take a while.