Fig. 2.
Download original image
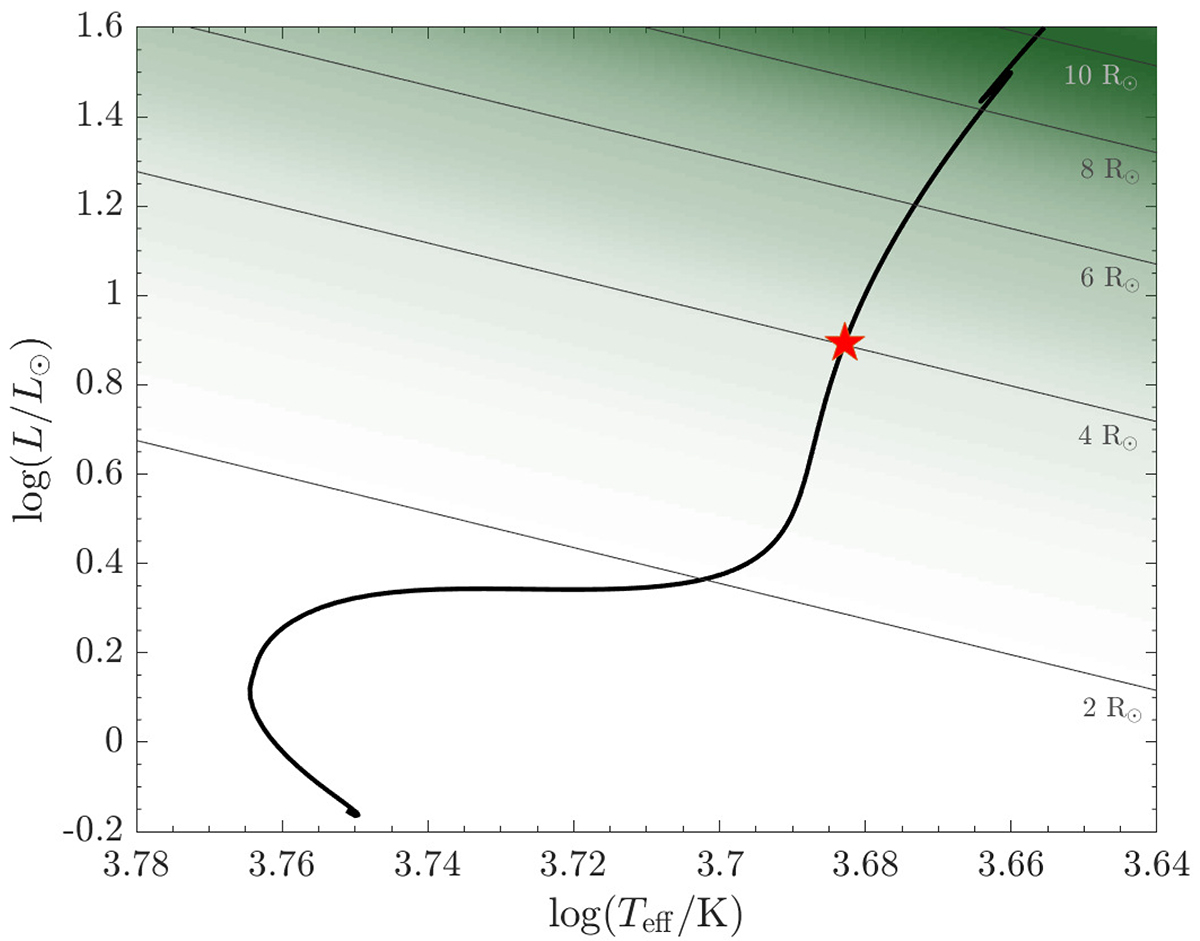
Evolutionary track of our 1 M⊙ stellar model on the H-R diagram, as calculated by MESA. The red star shows the location of the 4 R⊙ red giant model used in our simulation. The grey lines are constant radius contours. The intensity of green shading is proportional to the density of orbital separations in the NASA Exoplanet Archive.
Current usage metrics show cumulative count of Article Views (full-text article views including HTML views, PDF and ePub downloads, according to the available data) and Abstracts Views on Vision4Press platform.
Data correspond to usage on the plateform after 2015. The current usage metrics is available 48-96 hours after online publication and is updated daily on week days.
Initial download of the metrics may take a while.