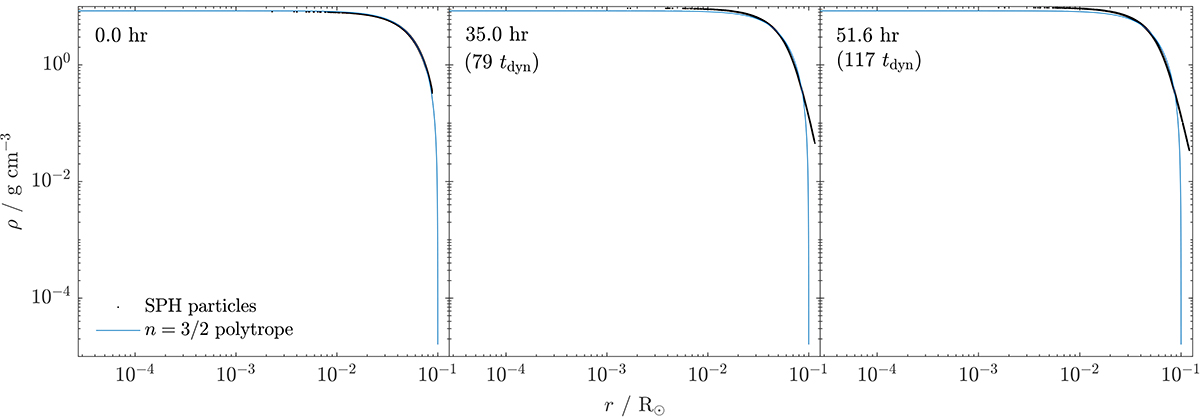
Fig. A.1.
Download original image
Density distribution of the HJ model at three different times when evolved in isolation, showing that the planet preserves its initial structure for a duration close to the planet-disruption time. The times of each profile and the ordinate scale are chosen to match the first three panels of Figure 9 to aid comparison. The time in units of the HJ’s free-fall time is also displayed in parentheses. Each black dot represents one of Np = 12, 300 SPH particles used to resolve the planet structure. The density profile of an n = 3/2 polytrope is plotted in blue for comparison.
Current usage metrics show cumulative count of Article Views (full-text article views including HTML views, PDF and ePub downloads, according to the available data) and Abstracts Views on Vision4Press platform.
Data correspond to usage on the plateform after 2015. The current usage metrics is available 48-96 hours after online publication and is updated daily on week days.
Initial download of the metrics may take a while.