Fig. 4
Download original image
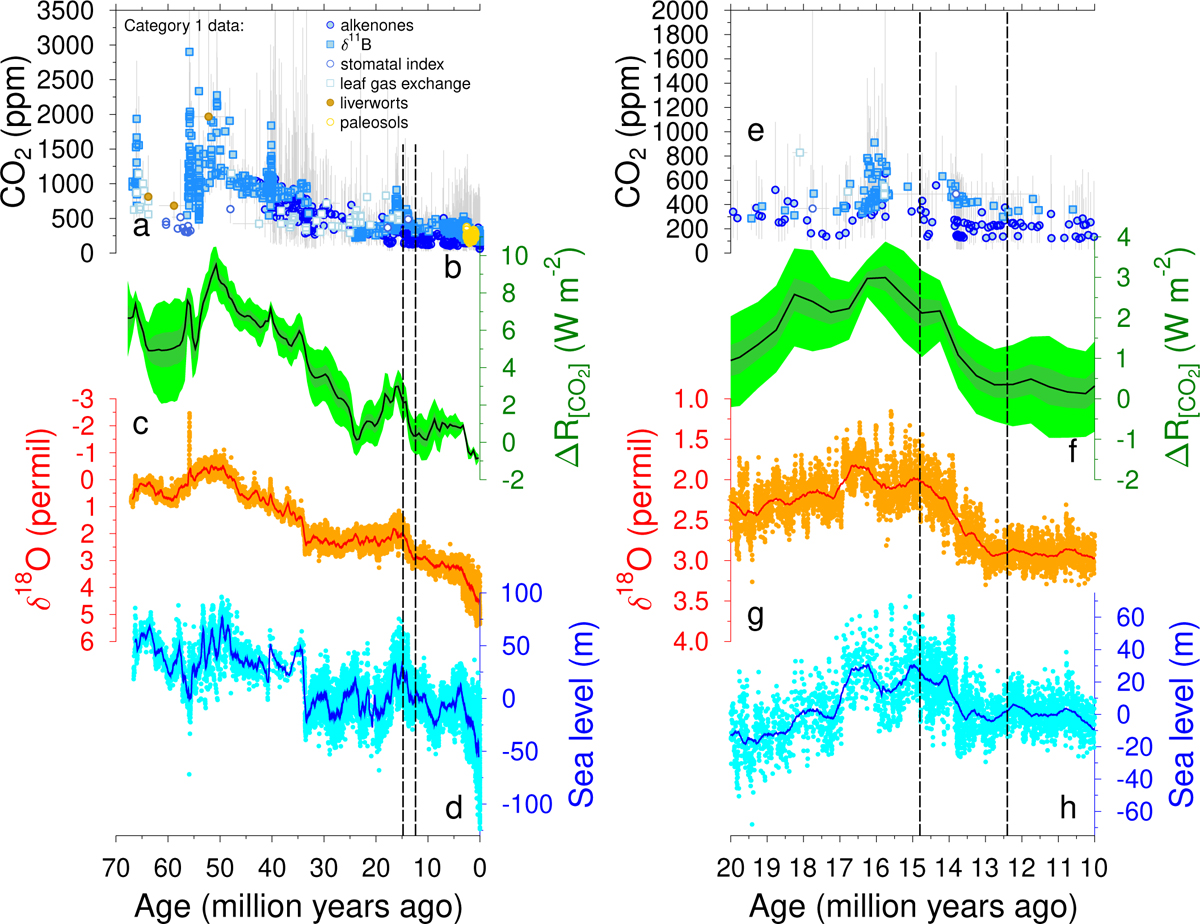
Cenozoic climate change. (a) Most recent compilation of category 1 (most trustworthy) atmospheric CO2 data (Cenozoic CO2 Proxy Integration Project (CenCO2PIP) Consortium 2023) as a function of proxy with their fully developed uncertainty estimates (95% confidence intervals). (b) CO2 radiative forcing ![]() , CO2,0 = 278 ppm) of a 500-kyr running mean through data with median and 50 and 95% credible intervals: dark and light-green shading, respectively (Cenozoic CO2 Proxy Integration Project (CenCO2PIP) Consortium 2023). (c) benthic δ18O recording a mixture of deep ocean temperature and sea level, raw data (points) and 500-kyr running mean (line) (Westerhold et al. 2020). (d) Reconstructed sea level change, raw data (points) and 500-kyr running mean (line) (Miller et al. 2020). Vertical broken lines mark the most likely time window (14.8–12.4 Myr ago, for dSun–cloud within 20–30 pc) of the Solar System being located in the dense region of the ISM suggested by this study. (e–h) Zoom in on the time window 20–10 Myr ago.
, CO2,0 = 278 ppm) of a 500-kyr running mean through data with median and 50 and 95% credible intervals: dark and light-green shading, respectively (Cenozoic CO2 Proxy Integration Project (CenCO2PIP) Consortium 2023). (c) benthic δ18O recording a mixture of deep ocean temperature and sea level, raw data (points) and 500-kyr running mean (line) (Westerhold et al. 2020). (d) Reconstructed sea level change, raw data (points) and 500-kyr running mean (line) (Miller et al. 2020). Vertical broken lines mark the most likely time window (14.8–12.4 Myr ago, for dSun–cloud within 20–30 pc) of the Solar System being located in the dense region of the ISM suggested by this study. (e–h) Zoom in on the time window 20–10 Myr ago.
Current usage metrics show cumulative count of Article Views (full-text article views including HTML views, PDF and ePub downloads, according to the available data) and Abstracts Views on Vision4Press platform.
Data correspond to usage on the plateform after 2015. The current usage metrics is available 48-96 hours after online publication and is updated daily on week days.
Initial download of the metrics may take a while.